Exam 14: One-Way Analysis of Variance- Comparing Several Means
Exam 1: Getting Started15 Questions
Exam 2: Picturing Distributions With Graphs36 Questions
Exam 3: Describing Distributions With Numbers44 Questions
Exam 4: The Normal Distributions37 Questions
Exam 5: Scatterplots and Correlation34 Questions
Exam 6: Two-Way Tables40 Questions
Exam 7: Producing Data- Sampling44 Questions
Exam 8: Producing Data- Experiments50 Questions
Exam 9: Data Ethics12 Questions
Exam 10: Introducing Probability66 Questions
Exam 11: General Rules of Probability52 Questions
Exam 12: Binomial Distributions39 Questions
Exam 13: Inference for Regression36 Questions
Exam 14: One-Way Analysis of Variance- Comparing Several Means28 Questions
Exam 15: Nonparametric Tests28 Questions
Exam 16: More on Analysis of Variance23 Questions
Select questions type
The one-way ANOVA is a generalization of what other statistical test?
(Multiple Choice)
4.9/5  (27)
(27)
Investigators gave caffeine to fruit flies to see if it affected their rest. The four treatments were a control, a low caffeine dose of 1 mg/ml of blood, a medium dose of 3 mg/ml of blood, and a higher caffeine dose of 5 mg/ml of blood. Twelve fruit flies were assigned at random to the four treatments, three to each treatment, and the minutes of rest measured over a 24-hour period were recorded. Assume the data that follow are four independent SRSs (one from each of the four populations of caffeine levels) and that the distribution of the yields is Normal. 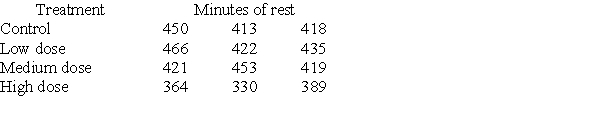 A partial ANOVA table produced by Minitab follows, along with the means and standard deviation of the yields for the four groups.
 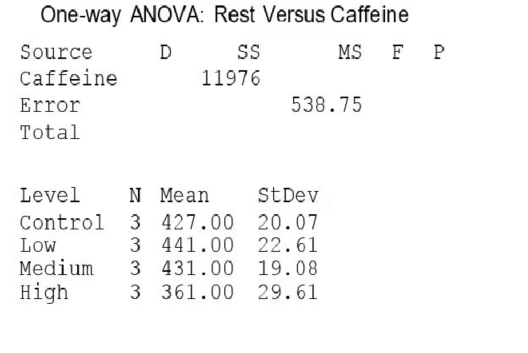 The conclusion that you would draw from this test is:
(Multiple Choice)
4.9/5 (28)
Investigators gave caffeine to fruit flies to see if it affected their rest. The four treatments were a control, a low caffeine dose of 1 mg/ml of blood, a medium dose of 3 mg/ml of blood, and a higher caffeine dose of 5 mg/ml of blood. Twelve fruit flies were assigned at random to the four treatments, three to each treatment, and the minutes of rest measured over a 24-hour period were recorded. Assume the data that follow are four independent SRSs (one from each of the four populations of caffeine levels) and that the distribution of the yields is Normal.  A partial ANOVA table produced by Minitab follows, along with the means and standard deviation of the yields for the four groups. The value of the ANOVA F statistic for testing equality of the population means of the average rest time for the four caffeine levels is:
(Multiple Choice)
4.9/5 (37)
Which of the following is a true statement about analysis of variance?
(Multiple Choice)
4.8/5 (30)
Investigators gave caffeine to fruit flies to see if it affected their rest. The four treatments were a control, a low caffeine dose of 1 mg/ml of blood, a medium dose of 3 mg/ml of blood, and a higher caffeine dose of 5 mg/ml of blood. Twelve fruit flies were assigned at random to the four treatments, three to each treatment, and the minutes of rest measured over a 24-hour period were recorded. Assume the data that follow are four independent SRSs (one from each of the four populations of caffeine levels) and that the distribution of the yields is Normal.  A partial ANOVA table produced by Minitab follows, along with the means and standard deviation of the yields for the four groups.
  The pooled standard deviation is:
(Multiple Choice)
4.8/5 (37)
Investigators gave caffeine to fruit flies to see if it affected their rest. The four treatments were a control, a low caffeine dose of 1 mg/ml of blood, a medium dose of 3 mg/ml of blood, and a higher caffeine dose of 5 mg/ml of blood. Twelve fruit flies were assigned at random to the four treatments, three to each treatment, and the minutes of rest measured over a 24-hour period were recorded. Assume the data that follow are four independent SRSs (one from each of the four populations of caffeine levels) and that the distribution of the yields is Normal.  A partial ANOVA table produced by Minitab follows, along with the means and standard deviation of the yields for the four groups. The P-value of this test is:
(Multiple Choice)
4.9/5 (38)
Many Americans complain about being sleep deprived. A team of psychologists researched the reasons for this sleep deprivation. After determining that one reason was poor time management, they devised a program to help people manage their time better. They recruited a random sample of 30 people at a major shopping center and randomly split them into three groups of size 10. Group 1 (the controls) received a logbook asking them to record the number of hours slept for a week but nothing else. Group 2 (the informed group) was shown a video to help improve time management. Group 3 (the intervention) participated in a two-day training course on improving time management. Groups 2 and 3 were also asked to keep records for one week on the number of hours slept. The psychologists were interested in learning if providing information or an intervention affects sleep time. Below are 95% Tukey simultaneous confidence intervals for the pairwise comparisons of all three pairs of means. 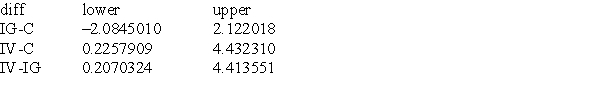 Based on these results, which of the following statements is true?
(Multiple Choice)
4.8/5 (36)
A company runs a three-day workshop on strategies for working effectively in teams. On each day, a different strategy is presented. Forty-eight employees of the company attend the workshop. At the outset, all 48 are divided into 12 teams of four. The teams remain the same for the entire workshop. Strategies are presented in the morning. In the afternoon, the teams are presented with a series of small tasks. The number of these tasks completed successfully, using the strategy taught that morning, is recorded for each team. The mean number of tasks completed successfully by all teams each day and the standard deviation are computed. The results follow. 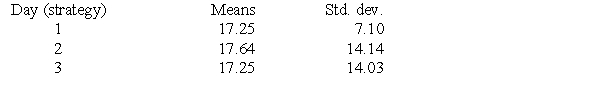 The researchers did an ANOVA F test of the data and obtained the following results.
  Which of the following conclusions is most reasonable?
(Multiple Choice)
4.9/5 (30)
Filters
- Essay(0)
- Multiple Choice(0)
- Short Answer(0)
- True False(0)
- Matching(0)