Exam 3: Describing Distributions With Numbers
Exam 1: Getting Started15 Questions
Exam 2: Picturing Distributions With Graphs36 Questions
Exam 3: Describing Distributions With Numbers44 Questions
Exam 4: The Normal Distributions37 Questions
Exam 5: Scatterplots and Correlation34 Questions
Exam 6: Two-Way Tables40 Questions
Exam 7: Producing Data- Sampling44 Questions
Exam 8: Producing Data- Experiments50 Questions
Exam 9: Data Ethics12 Questions
Exam 10: Introducing Probability66 Questions
Exam 11: General Rules of Probability52 Questions
Exam 12: Binomial Distributions39 Questions
Exam 13: Inference for Regression36 Questions
Exam 14: One-Way Analysis of Variance- Comparing Several Means28 Questions
Exam 15: Nonparametric Tests28 Questions
Exam 16: More on Analysis of Variance23 Questions
Select questions type
For each of the states and Puerto Rico, the histogram below shows the average property damage (in millions of dollars) caused by tornadoes over a 50-year period. 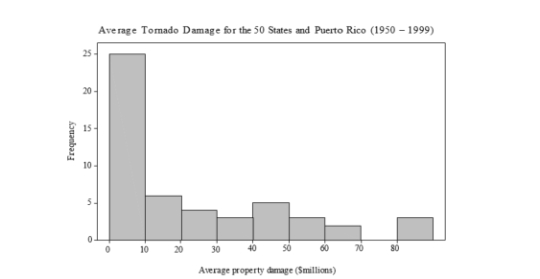 From the histogram, the first quartile must be:
(Multiple Choice)
4.8/5  (35)
(35)
A teacher returns an exam with possible scores ranging from 0 to 100. The students suspect that the majority of them performed poorly on the exam and request summary statistics. The teacher provides the mean, which was 72, as a summary statistic. A total of 400 students took the exam. Some of the students find the mean to be high, based on talking to other students. They take a random sample of 15 students, and they find that the mean equals 71.5 while the median equals 62. Based on this result, we conclude that:
(Multiple Choice)
4.9/5 (34)
Enteroliths are calcifications that form in the gut of a horse. The stones can cause considerable morbidity and mortality. A study was conducted to investigate factors (such as diet and environment) that may be related to the formation of enteroliths. The study contained 62 horses with enteroliths (cases) and 75 horses without (controls). The graph below contains side-by-side boxplots of the percent of alfalfa in the diet for cases and controls. 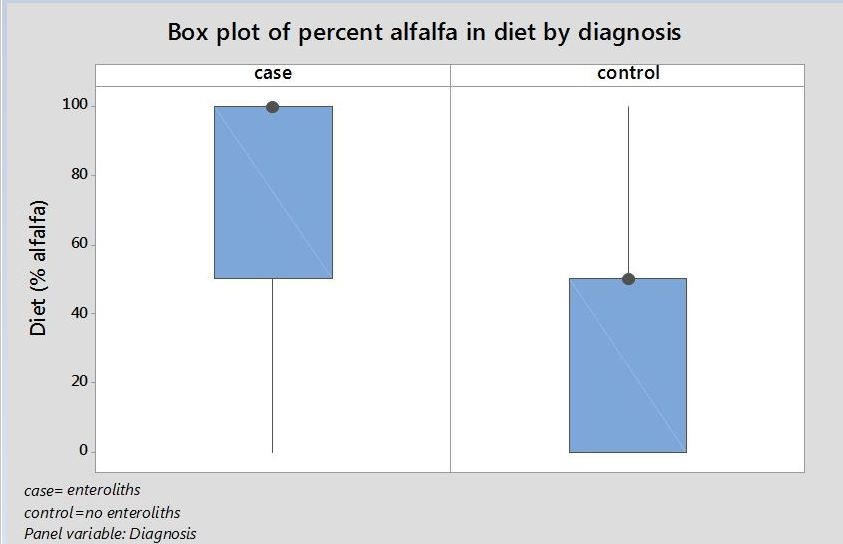 Based on the boxplot cases, the median amount of alfalfa in the diet of cases is:
(Multiple Choice)
4.9/5 (47)
The exam scores (out of 100 points) for all students taking an introductory statistics course are used to construct the following boxplot:  Based on this boxplot, which of the following statements is true?
(Multiple Choice)
4.9/5 (30)
A violin student records the number of hours she spends practicing during each of nine consecutive weeks:  Considering the smallest data value (1.2) and using the 1.5 × IQR rule, we would:
(Multiple Choice)
4.8/5 (40)
The following histogram represents the distribution of acceptance rates (percent accepted) among 25 business schools in 2004. In each class interval, the left endpoint but not the right is included, so the class intervals are 10 rate < 15, 15 rate < 20, etc.  Which of the following could be the five-number summary for these data?
(Multiple Choice)
4.7/5 (36)
The following histogram represents the distribution of acceptance rates (percent accepted) among 25 business schools in 2004. In each class interval, the left endpoint but not the right is included, so the class intervals are 10 rate < 15, 15 rate < 20, etc. 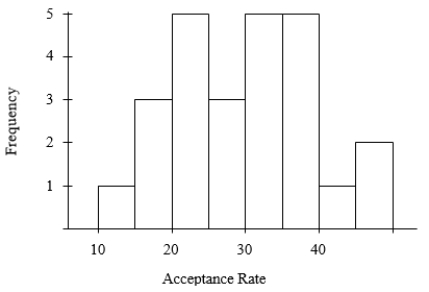 What is the median acceptance rate?
(Multiple Choice)
4.8/5 (38)
A survey of 10 students was conducted to investigate the amount of time they spend on social media each day. Students were given a timer and asked to record the number of minutes spent every time they accessed social media. The students' total times for one day are given below (in minutes).  The standard deviation for these data is:
(Multiple Choice)
4.9/5 (34)
The median age of five people in a meeting is 30 years. One of the people, whose age is 50 years, leaves the room. The median age of the remaining four people in the room is:
(Multiple Choice)
4.9/5 (34)
The exam scores (out of 100 points) for all students taking an introductory statistics course are used to construct the following boxplot: 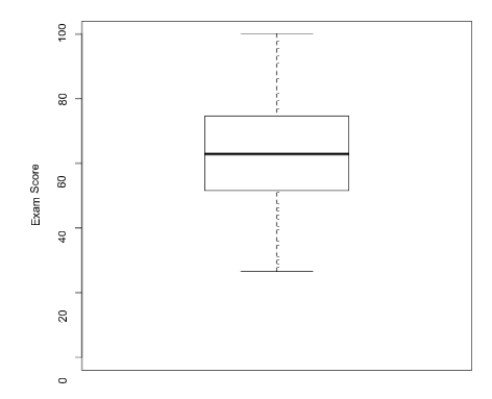 If 5 points were added to each score, then standard deviation of the new scores would:
(Multiple Choice)
4.9/5 (28)
The following is a sample of the percent increase in five growth funds over a one-year period.  The mean percent increase in this sample is:
(Multiple Choice)
4.9/5 (37)
A sample was taken of the salaries of 20 employees of a large company. The following is a boxplot of the salaries (in thousands of dollars) for this year. 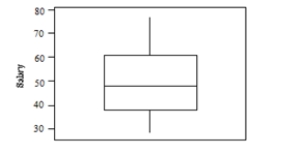 Based on this boxplot, the five-number summary (in thousands of dollars) is:
(Multiple Choice)
4.9/5 (43)
The 18 faculty members in a college math department range in age from 32 to 68. A stemplot follows: 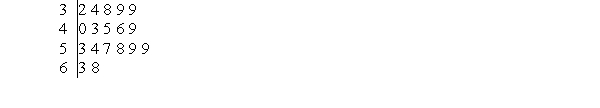 If the eldest faculty member retires and is replaced by a 26-year-old, the median age will:
(Multiple Choice)
4.8/5 (32)
A violin student records the number of hours she spends practicing during each of nine consecutive weeks:  What is the mean number of hours spent practicing per week during this period?
(Multiple Choice)
4.8/5 (33)
A survey of 10 students was conducted to investigate the amount of time they spend on social media each day. Students were given a timer and asked to record the number of minutes spent every time they accessed social media. The students' total times for one day are given below (in minutes).  The five-number summary for these data is:
(Multiple Choice)
4.9/5 (31)
A teacher returns an exam with possible scores ranging from 0 to 100. The students suspect that the majority of them performed poorly on the exam and request summary statistics. The teacher provides the mean, which was 72, as a summary statistic. A total of 400 students took the exam. Some of the students find the mean to be high, based on talking to other students. They take a random sample of 15 students, and they find that the mean equals 71.5 while the median equals 62. Based on this result, we conclude that:
(Multiple Choice)
4.8/5 (41)
Student ages (to the nearest year) in a school are as follows:  What is true about the median age?
(Multiple Choice)
4.9/5 (37)
Student ages (to the nearest year) in a school are as follows:  What is true about the mean age?
(Multiple Choice)
4.9/5 (31)
A violin student records the number of hours she spends practicing during each of nine consecutive weeks:  What is the first quartile for these data?
(Multiple Choice)
4.8/5 (37)
The average salary of all female workers at a large plant is $35,000. The average salary of all male workers at the plant is $41,000. If there are more female workers than male workers at the plant, then the average salary at the plant must be:
(Multiple Choice)
4.7/5 (30)
Filters
- Essay(0)
- Multiple Choice(0)
- Short Answer(0)
- True False(0)
- Matching(0)