Exam 25: Exploring and Collecting Data
Exam 2: Data30 Questions
Exam 3: Surveys and Sampling28 Questions
Exam 4: Displaying and Describing Categorical Data32 Questions
Exam 5: Displaying and Describing Quantitative Data32 Questions
Exam 6: Scatterplots, Association, and Correlation32 Questions
Exam 7: Introduction to Linear Regression32 Questions
Exam 8: Randomness and Probability32 Questions
Exam 9: Random Variables and Probability Distributions28 Questions
Exam 10: Sampling Distributions28 Questions
Exam 11: Confidence Intervals for Proportions32 Questions
Exam 12: Testing Hypotheses About Proportions36 Questions
Exam 13: Confidence Intervals and Hypothesis Tests for Means36 Questions
Exam 14: Comparing Two Means32 Questions
Exam 15: Design of Experiments and Analysis of Variance Anova24 Questions
Exam 16: Inference for Counts: Chi-Square Tests26 Questions
Exam 17: Nonparametric Methods26 Questions
Exam 18: Inference for Regression32 Questions
Exam 19: Understanding Regression Residuals28 Questions
Exam 20: Multiple Regression22 Questions
Exam 21: Building Multiple Regression Models22 Questions
Exam 22: Time Series Analysis28 Questions
Exam 23: Decision Making and Risk32 Questions
Exam 24: Quality Control28 Questions
Exam 25: Exploring and Collecting Data32 Questions
Exam 26: Understanding Probability Distributions and Statistical Inference73 Questions
Exam 27: Exploring Relationships Among Variables40 Questions
Exam 28: Using Statistics for Decision Making26 Questions
Select questions type
Use the following to answer the question(s) below.
A magazine that publishes product reviews conducted a survey of teenagers' preferences for cell phones. Three brands of cell phone designed specifically with teens in mind were the focus of the study. The table summarizes responses by brand and gender.
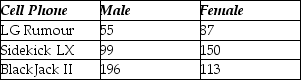 -What percent of teenagers who preferred the BlackJack II were males?
Free
(Multiple Choice)
4.8/5  (41)
(41)
Correct Answer: Verified
A
An office supply chain has stores in two locations, Toronto and Vancouver. One of these stores is to be closed within the coming year, and to help make the decision, management reviews sales data. Below are boxplots for monthly unit sales for both locations. 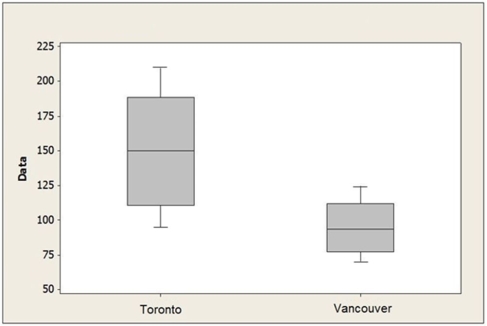 Which of the following statements is not correct?
Free
(Multiple Choice)
4.9/5 (28)
Correct Answer:Verified
E
If a parameter is computed from a set of data, which of the following statements is true?
Free
(Multiple Choice)
4.8/5 (32)
Correct Answer:Verified
A
Use the following to answer the question(s) below.
Below is Excel output showing the coefficient of correlation between personal income and vacation expenses (both in $thousands) for a large sample of clients of one travel agency in Toronto. 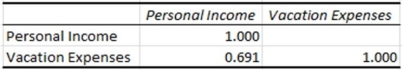 -What percent of the variation of vacation expenses can be explained by variation of personal income?
(Multiple Choice)
4.8/5 (35)
Use the following to answer the question(s) below.
Boxplots of earnings per share (EPS) data for a sample of retail company stocks and a sample of energy company stocks are shown below. 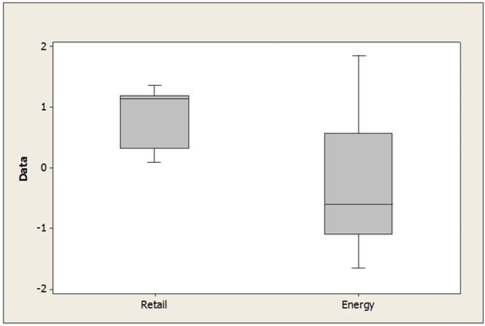 -Which of the following statements is correct?
(Multiple Choice)
4.7/5 (32)
In listing a property, real estate agencies provides information on a number of variables. Which of the following variables related to property listings is categorical?
(Multiple Choice)
5.0/5 (33)
Use the following to answer the question(s) below.
A consumer magazine evaluated the price and performance of 23 models of cordless phones. Computer output gives this summary for the prices ($):
 -The IQR for these data is
(Multiple Choice)
4.8/5 (41)
Use the following to answer the question(s) below.
A magazine that publishes product reviews conducted a survey of teenagers' preferences for cell phones. Three brands of cell phone designed specifically with teens in mind were the focus of the study. The table summarizes responses by brand and gender.
-What percent of female teenagers preferred the Sidekick LX?
(Multiple Choice)
4.8/5 (37)
Use the following to answer the question(s) below.
Summary statistics and a histogram for certain data are shown below.

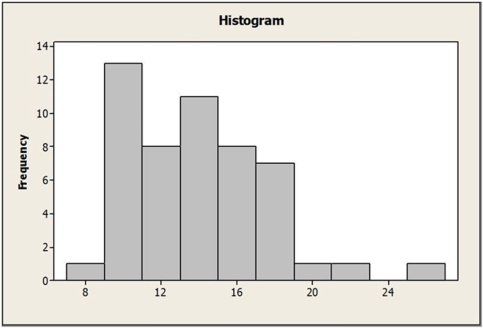 -What is the most appropriate measure to describe the centre of these data?
(Multiple Choice)
4.9/5 (37)
A researcher is conducting a study on eating disorders. Using a list of recent participants in the online Weight Watchers program, she randomly selects a name from the alphabetized list. She then chooses every tenth person from that point on to include in her study. This sampling strategy is called
(Multiple Choice)
4.9/5 (35)
Use the following to answer the question(s) below.
A manager of Kim & Lim corporate strategy department thinks that dollars spent on advertising can to some extent be a predictor of total sales dollars. As an aid in long-term planning, she analyzes the following sales and advertising numbers for 2015 (both in $millions). Information was collected from eight companies of Kim & Lim.
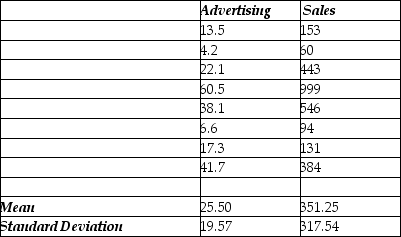 -Use the following regression equation Total Sales = -35.017 + 15.148 Advertising To express statistical dependence of total sales on advertising expenses in the given sample (both numbers in $millions). A company with $5,900,000 advertising expenses is expected to have total sales of
(Multiple Choice)
4.7/5 (31)
Real estate agencies also keep track of housing prices in a given area. Suppose they also provide their clients with quarterly median selling prices for homes in a given area for the past three year period. These data are
(Multiple Choice)
4.9/5 (26)
Suppose a sample of 60 crates has a mean weight of 12.1 kilograms and a standard deviation of 0.05 kilograms. If a crate has the weight of 12 kilograms, what is its corresponding z-score?
(Multiple Choice)
4.9/5 (32)
Use the following to answer the question(s) below.
Boxplots of earnings per share (EPS) data for a sample of retail company stocks and a sample of energy company stocks are shown below.
-Which of the following statements is true about the distributions of EPS for retail and energy stocks?
(Multiple Choice)
4.9/5 (34)
Below is a stem-and-leaf display of prices for a sample of homes recently sold in a metropolitan area in Canada. 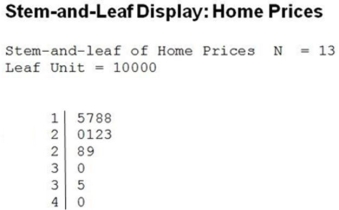 Which of the following statements is true?
(Multiple Choice)
4.8/5 (34)
Use the following to answer the question(s) below.
A magazine that publishes product reviews conducted a survey of teenagers' preferences for cell phones. Three brands of cell phone designed specifically with teens in mind were the focus of the study. The table summarizes responses by brand and gender.
-Which of the following charts would be appropriate for displaying the marginal distribution of brands?
(Multiple Choice)
4.9/5 (26)
Use the following to answer the question(s) below.
A recent survey of online shoppers asked them to indicate the primary reason they shop via the Internet. The table summarizes responses by reason and gender.
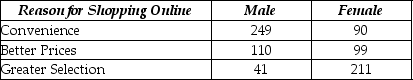 -What percent of respondents cite Convenience as the primary reason they shop online?
(Multiple Choice)
4.7/5 (22)
What type of variable is the style of a home (bungalow, split level, ranch, etc.)?
(Multiple Choice)
4.9/5 (23)
Use the following to answer the question(s) below.
Summary statistics and a histogram for certain data are shown below.
-The IQR for these data is
(Multiple Choice)
4.9/5 (33)
Filters
- Essay(0)
- Multiple Choice(0)
- Short Answer(0)
- True False(0)
- Matching(0)