Exam 5: Displaying and Describing Quantitative Data
Exam 2: Data30 Questions
Exam 3: Surveys and Sampling28 Questions
Exam 4: Displaying and Describing Categorical Data32 Questions
Exam 5: Displaying and Describing Quantitative Data32 Questions
Exam 6: Scatterplots, Association, and Correlation32 Questions
Exam 7: Introduction to Linear Regression32 Questions
Exam 8: Randomness and Probability32 Questions
Exam 9: Random Variables and Probability Distributions28 Questions
Exam 10: Sampling Distributions28 Questions
Exam 11: Confidence Intervals for Proportions32 Questions
Exam 12: Testing Hypotheses About Proportions36 Questions
Exam 13: Confidence Intervals and Hypothesis Tests for Means36 Questions
Exam 14: Comparing Two Means32 Questions
Exam 15: Design of Experiments and Analysis of Variance Anova24 Questions
Exam 16: Inference for Counts: Chi-Square Tests26 Questions
Exam 17: Nonparametric Methods26 Questions
Exam 18: Inference for Regression32 Questions
Exam 19: Understanding Regression Residuals28 Questions
Exam 20: Multiple Regression22 Questions
Exam 21: Building Multiple Regression Models22 Questions
Exam 22: Time Series Analysis28 Questions
Exam 23: Decision Making and Risk32 Questions
Exam 24: Quality Control28 Questions
Exam 25: Exploring and Collecting Data32 Questions
Exam 26: Understanding Probability Distributions and Statistical Inference73 Questions
Exam 27: Exploring Relationships Among Variables40 Questions
Exam 28: Using Statistics for Decision Making26 Questions
Select questions type
Consider the following to answer the question(s) below:
The table below shows closing share prices for a small sample of companies.
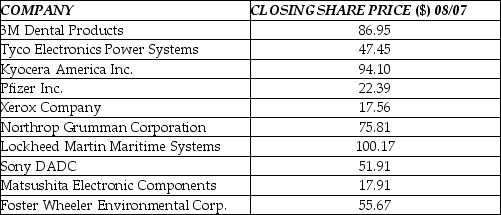 -The mean closing share price is
Free
(Multiple Choice)
4.9/5  (43)
(43)
Correct Answer: Verified
C
Consider the following to answer the question(s) below:
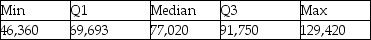
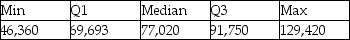
Below is a histogram and the five-number summary for salaries (in $) for a sample of marketing managers. 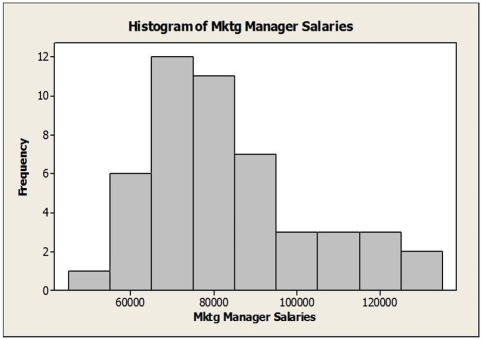
 -The upper and lower "fences" for a boxplot of these data are
Free
(Multiple Choice)
4.7/5 (43)
Correct Answer:Verified
D
Consider the following to answer the question(s) below:
Below is a histogram and the five-number summary for salaries (in $) for a sample of marketing managers.
-The most appropriate measure of central tendency for these data is the
Free
(Multiple Choice)
4.8/5 (33)
Correct Answer:Verified
A
Consider the following to answer the question(s) below:
A consumer research group investigating the relationship between the price of meat (per kilogram) and the fat content (grams) gathered data that produced the following scatterplot. 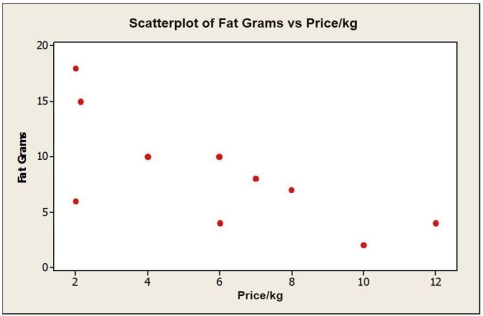 -Below is a histogram of salaries (in $) for a sample of marketing managers. Comment on the shape of the distribution.
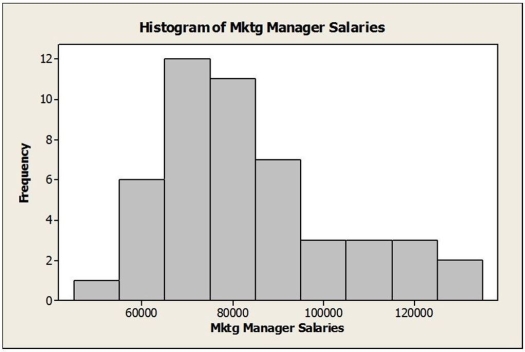
(Essay)
4.9/5 (40)
Consider the following to answer the question(s) below:
A consumer research group investigating the relationship between the price of meat (per kilogram) and the fat content (grams) gathered data that produced the following scatterplot.
-Below is the five-number summary of salaries (in $) for a sample of marketing managers.
 a. Would you expect the mean salary for this sample of marketing managers to be higher or lower than the median? Explain.
b. Which would be a more appropriate measure of central tendency for these data, the mean or median? Explain.
c. Calculate the range.
d. Calculate the IQR.
a. Would you expect the mean salary for this sample of marketing managers to be higher or lower than the median? Explain.
b. Which would be a more appropriate measure of central tendency for these data, the mean or median? Explain.
c. Calculate the range.
d. Calculate the IQR.
(Essay)
4.9/5 (32)
Consider the following to answer the question(s) below:
A consumer research group investigating the relationship between the price of meat (per kilogram) and the fat content (grams) gathered data that produced the following scatterplot.
-Data were collected on the hourly wage ($) for two types of marketing managers: (1) advertising / promotion managers and (2) sales managers. The results were used to create the histograms below. 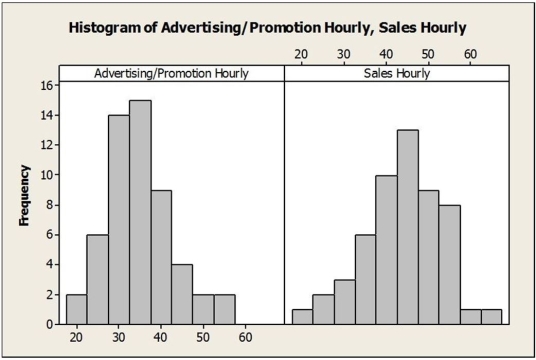 a. Describe the hourly wage distribution for advertising/promotion managers.
b. Describe the hourly wage distribution for sales managers.
c. Compare the hourly wages for the two types of marketing managers based on the histograms.
a. Describe the hourly wage distribution for advertising/promotion managers.
b. Describe the hourly wage distribution for sales managers.
c. Compare the hourly wages for the two types of marketing managers based on the histograms.
(Essay)
4.9/5 (43)
Consider the following to answer the question(s) below:
The boxplots below show monthly sales revenue figures ($ thousands) for a discount office supply company with locations in three different regions of Canada (Atlantic, Central and West). 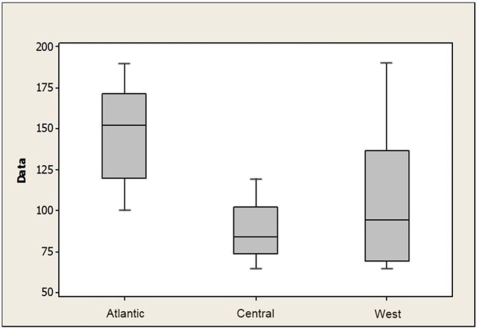 -Sample data were collected on the number of hours per day students spent at the computer or iPad.
  Which one of the following statements is true?
(Multiple Choice)
4.8/5 (28)
Consider the following to answer the question(s) below:
The boxplots below show monthly sales revenue figures ($ thousands) for a discount office supply company with locations in three different regions of Canada (Atlantic, Central and West).
-Given the boxplot below, which one of the following statements is correct? 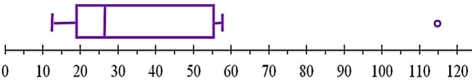
(Multiple Choice)
4.8/5 (36)
Consider the following to answer the question(s) below:
The boxplots below show monthly sales revenue figures ($ thousands) for a discount office supply company with locations in three different regions of Canada (Atlantic, Central and West).
-Below is a time series plot for monthly closing stock prices of 3M Dental Products. Which of the following statements is true? 
(Multiple Choice)
5.0/5 (34)
Consider the following to answer the question(s) below:
A consumer research group investigating the relationship between the price of meat (per kilogram) and the fat content (grams) gathered data that produced the following scatterplot.
-The table below shows data on total assets ($ million) for a sample of bank branches.
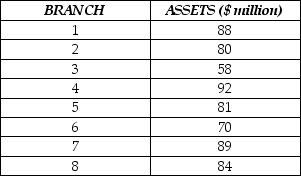 For the data on total assets ($ million) for the sample provided:
a. Calculate the mean.
b. Calculate the standard deviation.
c. Standardize the asset value of the third branch (find the z-score). Interpret its meaning.
For the data on total assets ($ million) for the sample provided:
a. Calculate the mean.
b. Calculate the standard deviation.
c. Standardize the asset value of the third branch (find the z-score). Interpret its meaning.
(Essay)
4.7/5 (30)
Consider the following to answer the question(s) below:
The boxplots below show monthly sales revenue figures ($ thousands) for a discount office supply company with locations in three different regions of Canada (Atlantic, Central and West).
-A student recently wrote an entrance exam and was informed that his score placed him at the 80th percentile. This indicates that
(Multiple Choice)
4.9/5 (30)
Consider the following to answer the question(s) below:
A consumer research group investigating the relationship between the price of meat (per kilogram) and the fat content (grams) gathered data that produced the following scatterplot.
-The boxplots below show the closing share prices for a sample of companies on the first trading days in August 2015 and in August 2010. 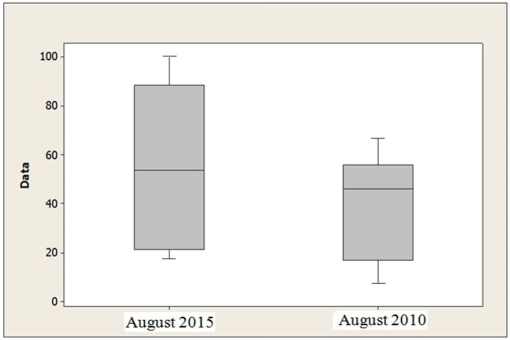 a. For which day was the median closing share price higher?
b. For which day were the closing share prices more variable? Explain.
c. Which distribution is more symmetric? Explain.
a. For which day was the median closing share price higher?
b. For which day were the closing share prices more variable? Explain.
c. Which distribution is more symmetric? Explain.
(Essay)
4.8/5 (33)
Consider the following to answer the question(s) below:
Below is a histogram and the five-number summary for salaries (in $) for a sample of marketing managers.
-The shape of this distribution is
(Multiple Choice)
4.7/5 (36)
Consider the following to answer the question(s) below:
The boxplots below show monthly sales revenue figures ($ thousands) for a discount office supply company with locations in three different regions of Canada (Atlantic, Central and West).
-Which of the following best describes the difference between stem-and-leaf displays and histograms?
(Multiple Choice)
4.8/5 (31)
Consider the following to answer the question(s) below:
The boxplots below show monthly sales revenue figures ($ thousands) for a discount office supply company with locations in three different regions of Canada (Atlantic, Central and West).
-Which of the following statements is false?
(Multiple Choice)
4.8/5 (36)
Consider the following to answer the question(s) below:
The boxplots below show monthly sales revenue figures ($ thousands) for a discount office supply company with locations in three different regions of Canada (Atlantic, Central and West).
-A sample of families with children at a local school is found to have a mean of 3.2 members per family. The mode number of family members is 2 and the median number is 2.0. Based on this information, which statement is true?
(Multiple Choice)
4.7/5 (31)
Consider the following to answer the question(s) below:
The boxplots below show monthly sales revenue figures ($ thousands) for a discount office supply company with locations in three different regions of Canada (Atlantic, Central and West).
-Which of the following statements is false?
(Multiple Choice)
4.8/5 (42)
Consider the following to answer the question(s) below:
A consumer research group investigating the relationship between the price of meat (per kilogram) and the fat content (grams) gathered data that produced the following scatterplot.
-Below is a time series plot for monthly closing price of 3M Dental Products stock (beginning June 2005). 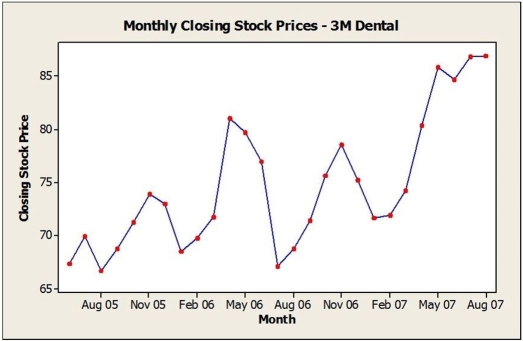 a. Are the closing prices for shares of 3M Dental Products from June 2005 through August 2007 stationary? Explain.
b. Would a histogram provide a good summary of these stock prices? Explain.
a. Are the closing prices for shares of 3M Dental Products from June 2005 through August 2007 stationary? Explain.
b. Would a histogram provide a good summary of these stock prices? Explain.
(Essay)
5.0/5 (39)
Consider the following to answer the question(s) below:
The boxplots below show monthly sales revenue figures ($ thousands) for a discount office supply company with locations in three different regions of Canada (Atlantic, Central and West).
-Which of the following statements is true?
(Multiple Choice)
4.8/5 (35)
Consider the following to answer the question(s) below:
Below is a histogram and the five-number summary for salaries (in $) for a sample of marketing managers.
-The IQR for these data is
(Multiple Choice)
4.8/5 (35)
Filters
- Essay(0)
- Multiple Choice(0)
- Short Answer(0)
- True False(0)
- Matching(0)