Exam 18: Inference for Regression
Exam 2: Data30 Questions
Exam 3: Surveys and Sampling28 Questions
Exam 4: Displaying and Describing Categorical Data32 Questions
Exam 5: Displaying and Describing Quantitative Data32 Questions
Exam 6: Scatterplots, Association, and Correlation32 Questions
Exam 7: Introduction to Linear Regression32 Questions
Exam 8: Randomness and Probability32 Questions
Exam 9: Random Variables and Probability Distributions28 Questions
Exam 10: Sampling Distributions28 Questions
Exam 11: Confidence Intervals for Proportions32 Questions
Exam 12: Testing Hypotheses About Proportions36 Questions
Exam 13: Confidence Intervals and Hypothesis Tests for Means36 Questions
Exam 14: Comparing Two Means32 Questions
Exam 15: Design of Experiments and Analysis of Variance Anova24 Questions
Exam 16: Inference for Counts: Chi-Square Tests26 Questions
Exam 17: Nonparametric Methods26 Questions
Exam 18: Inference for Regression32 Questions
Exam 19: Understanding Regression Residuals28 Questions
Exam 20: Multiple Regression22 Questions
Exam 21: Building Multiple Regression Models22 Questions
Exam 22: Time Series Analysis28 Questions
Exam 23: Decision Making and Risk32 Questions
Exam 24: Quality Control28 Questions
Exam 25: Exploring and Collecting Data32 Questions
Exam 26: Understanding Probability Distributions and Statistical Inference73 Questions
Exam 27: Exploring Relationships Among Variables40 Questions
Exam 28: Using Statistics for Decision Making26 Questions
Select questions type
Consider the following to answer the question(s) below:
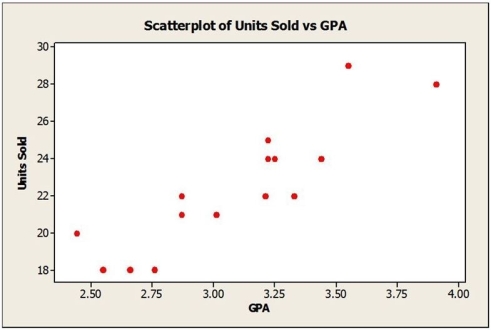
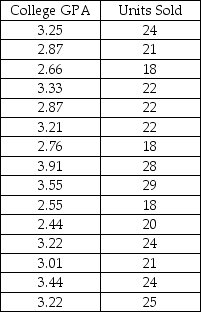
A sales manager was interested in determining if there is a relationship between college GPA and sales performance among salespeople hired within the last year. A sample of recently hired salespeople was selected and the number of units each sold last month was recorded. Relevant data appear in the table below.
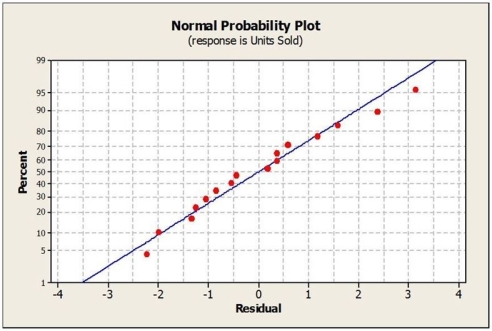
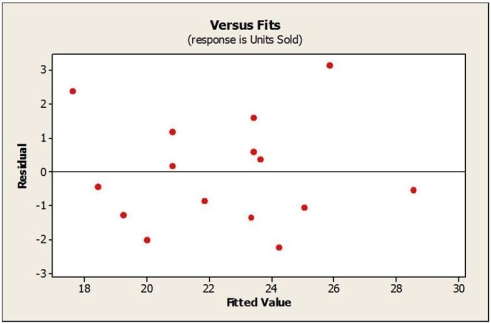
 Below are the scatterplot, regression results, and residual plots for these data.
 -The correct null hypothesis is
Free
(Multiple Choice)
4.9/5  (40)
(40)
Correct Answer: Verified
D
Consider the following to answer the question(s) below:
A sales manager was interested in determining if there is a relationship between college GPA and sales performance among salespeople hired within the last year. A sample of recently hired salespeople was selected and the number of units each sold last month was recorded. Relevant data appear in the table below.
 Below are the scatterplot, regression results, and residual plots for these data.
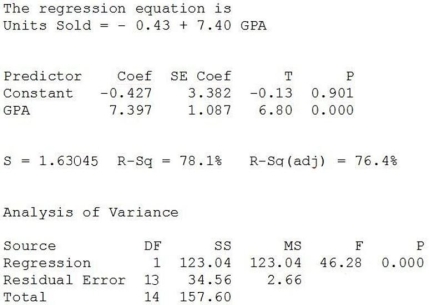


 -Predict the units sold per month for a new hire whose college GPA is 3.00.
Free
(Essay)
4.8/5 (33)
Correct Answer:Verified
For a GPA = 3, the regression equation predicts  = -0.43 + 7.40(3) = 21.77 units sold per month.
Consider the following to answer the question(s) below:
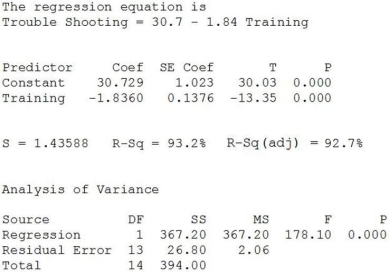
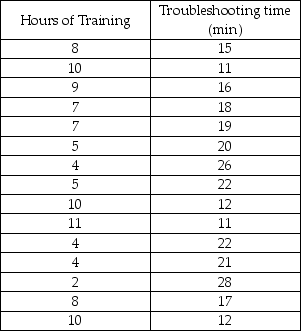
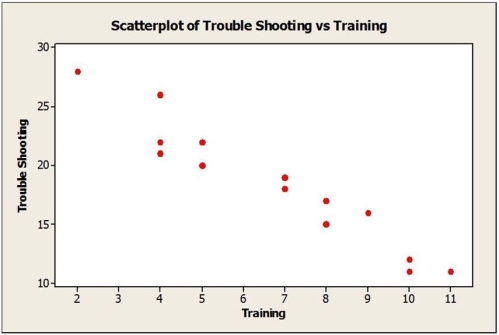
An operations manager was interested in determining if there is a relationship between the amount of training received by production line workers and the time it takes for them to troubleshoot a process problem. A sample of recently trained line workers was selected. The number of hours of training time received and the time it took (in minutes) for them to troubleshoot their last process problem were captured. The data, scatterplot and regression results are shown below.


 -Based on the regression equation
  = 30.7 - 1.84x, the troubleshooting time for a line worker who receives 8 hours of training would be
Free
(Multiple Choice)
4.8/5 (39)
Correct Answer:Verified
B
Consider the following to answer the question(s) below:
An operations manager was interested in determining if there is a relationship between the amount of training received by production line workers and the time it takes for them to troubleshoot a process problem. A sample of recently trained line workers was selected. The number of hours of training time received and the time it took (in minutes) for them to troubleshoot their last process problem were captured. The data, scatterplot and regression results are shown below.
-In testing the null hypothesis H0: β1 = 0, the correct value of the test statistic is
(Multiple Choice)
4.7/5 (37)
Consider the following to answer the question(s) below:
An operations manager was interested in determining if there is a relationship between the amount of training received by production line workers and the time it takes for them to troubleshoot a process problem. A sample of recently trained line workers was selected. The number of hours of training time received and the time it took (in minutes) for them to troubleshoot their last process problem were captured. Relevant data appear in the table below.
 Below are the scatterplot, regression results, and residual plots for these data.
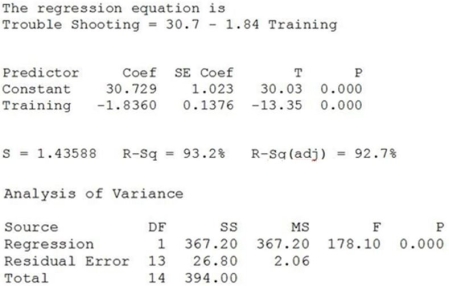
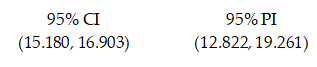
 -The confidence interval and prediction interval for troubleshooting time with 8 hours of training are shown below. Interpret both intervals in this context.
(Essay)
4.8/5 (37)
Consider the following to answer the question(s) below:
An operations manager was interested in determining if there is a relationship between the amount of training received by production line workers and the time it takes for them to troubleshoot a process problem. A sample of recently trained line workers was selected. The number of hours of training time received and the time it took (in minutes) for them to troubleshoot their last process problem were captured. Relevant data appear in the table below.
Below are the scatterplot, regression results, and residual plots for these data.
-Predict the troubleshooting time for a line worker who received 8 hours of training.
(Essay)
4.7/5 (23)
Consider the following to answer the question(s) below:
A sales manager was interested in determining if there is a relationship between college GPA and sales performance among salespeople hired within the last year. A sample of recently hired salespeople was selected and the number of units each sold last month was recorded. Relevant data appear in the table below.
Below are the scatterplot, regression results, and residual plots for these data.
-What percentage of the variability in sales performance (units sold per month) can be accounted for by college GPA?
(Essay)
4.8/5 (37)
In testing the null hypothesis that the correlation coefficient, ρ, equals 0, the correct critical values at 5% significance level are
-The 95% confidence interval for the slope is
(Multiple Choice)
4.8/5 (36)
Consider the following to answer the question(s) below:
A sales manager was interested in determining if there is a relationship between college GPA and sales performance among salespeople hired within the last year. A sample of recently hired salespeople was selected and the number of units each sold last month was recorded. Relevant data appear in the table below.
Below are the scatterplot, regression results, and residual plots for these data.
-Which of the following assumptions and/or conditions for regression and inference is not satisfied?
(Multiple Choice)
4.9/5 (35)
Consider the following to answer the question(s) below:
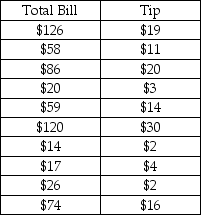
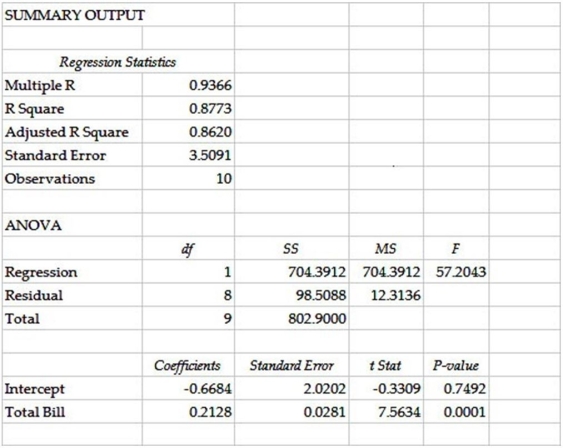
A study was recently performed by the Canada Revenue Agency to determine how much tip income waiters and waitresses would make based on the size of the bill at the table. A random sample of bills and resulting tips was collected. These data and regression results are as follows:
 -In testing the null hypothesis that the correlation coefficient, ρ, equals 0, the correct critical values at 5% significance level are
(Multiple Choice)
4.8/5 (43)
Consider the following to answer the question(s) below:
A sales manager was interested in determining if there is a relationship between college GPA and sales performance among salespeople hired within the last year. A sample of recently hired salespeople was selected and the number of units each sold last month was recorded. Relevant data appear in the table below.
Below are the scatterplot, regression results, and residual plots for these data.
-At α = 0 .05,
(Multiple Choice)
4.9/5 (27)
Consider the following to answer the question(s) below:
A study was recently performed by the Canada Revenue Agency to determine how much tip income waiters and waitresses would make based on the size of the bill at the table. A random sample of bills and resulting tips was collected. These data and regression results are as follows:
-In testing the null hypothesis that the correlation coefficient, ρ, equals 0, the correct value of the test statistic is
(Multiple Choice)
4.9/5 (28)
Consider the following to answer the question(s) below:
An operations manager was interested in determining if there is a relationship between the amount of training received by production line workers and the time it takes for them to troubleshoot a process problem. A sample of recently trained line workers was selected. The number of hours of training time received and the time it took (in minutes) for them to troubleshoot their last process problem were captured. The data, scatterplot and regression results are shown below.
-At α = 0.05,
(Multiple Choice)
5.0/5 (33)
Consider the following to answer the question(s) below:
An operations manager was interested in determining if there is a relationship between the amount of training received by production line workers and the time it takes for them to troubleshoot a process problem. A sample of recently trained line workers was selected. The number of hours of training time received and the time it took (in minutes) for them to troubleshoot their last process problem were captured. Relevant data appear in the table below.
Below are the scatterplot, regression results, and residual plots for these data.
-What percentage of the variability in troubleshooting time can be accounted for by amount of training received?
(Essay)
5.0/5 (35)
Consider the following to answer the question(s) below:
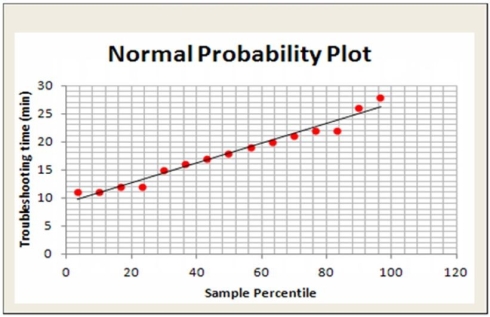
An operations manager was interested in determining if there is a relationship between the amount of training received by production line workers and the time it takes for them to troubleshoot a process problem. A sample of recently trained line workers was selected. The number of hours of training time received and the time it took (in minutes) for them to troubleshoot their last process problem were captured. Relevant data appear in the table below.
Below are the scatterplot, regression results, and residual plots for these data.
-Are the assumptions / conditions for regression and inference satisfied? Explain.
(Essay)
4.9/5 (38)
Consider the following to answer the question(s) below:
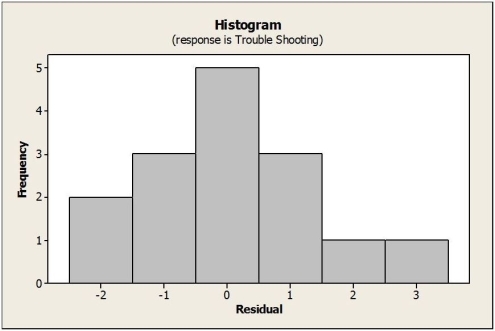
An operations manager was interested in determining if there is a relationship between the amount of training received by production line workers and the time it takes for them to troubleshoot a process problem. A sample of recently trained line workers was selected. The number of hours of training time received and the time it took (in minutes) for them to troubleshoot their last process problem were captured. The data, scatterplot and regression results are shown below.
-From the histogram of residuals below we can say 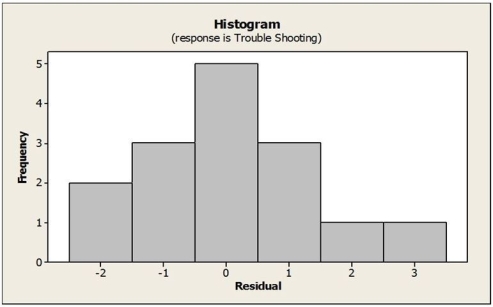
(Multiple Choice)
4.8/5 (26)
Consider the following to answer the question(s) below:
A study was recently performed by the Canada Revenue Agency to determine how much tip income waiters and waitresses would make based on the size of the bill at the table. A random sample of bills and resulting tips was collected. These data and regression results are as follows:
-In testing the null hypothesis H0: β1 = 0, at α = 0.05
(Multiple Choice)
4.7/5 (46)
In testing the null hypothesis that the correlation coefficient, ρ, equals 0, the correct critical values at 5% significance level are
-In testing the null hypothesis that the correlation coefficient, ρ, equals 0, at α = 0.05
(Multiple Choice)
4.8/5 (34)
Consider the following to answer the question(s) below:
An operations manager was interested in determining if there is a relationship between the amount of training received by production line workers and the time it takes for them to troubleshoot a process problem. A sample of recently trained line workers was selected. The number of hours of training time received and the time it took (in minutes) for them to troubleshoot their last process problem were captured. Relevant data appear in the table below.
Below are the scatterplot, regression results, and residual plots for these data.
-Is there a significant relationship between time it takes to troubleshoot the process (minutes) and training received (use α = 0 .05)? Give the appropriate test statistic, associated P-value, and conclusion.
(Essay)
4.8/5 (28)
Consider the following to answer the question(s) below:
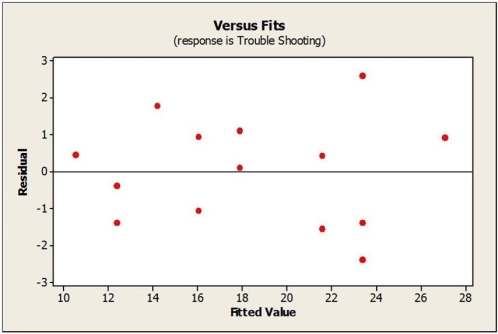
An operations manager was interested in determining if there is a relationship between the amount of training received by production line workers and the time it takes for them to troubleshoot a process problem. A sample of recently trained line workers was selected. The number of hours of training time received and the time it took (in minutes) for them to troubleshoot their last process problem were captured. The data, scatterplot and regression results are shown below.
-From the residual plot below we can say 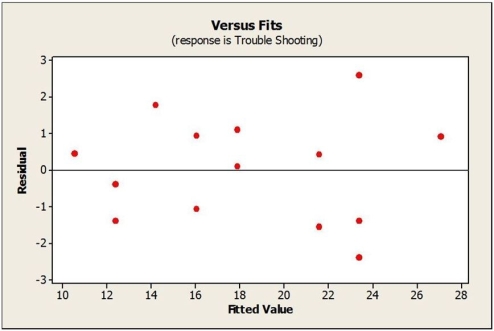
(Multiple Choice)
4.8/5 (41)
Filters
- Essay(0)
- Multiple Choice(0)
- Short Answer(0)
- True False(0)
- Matching(0)