Exam 11: Factorial Design: I Lost My Phone Number, Can I Borrow Yours Do Pickup Lines Really Work
Exam 1: Psychology As Science: Thinking Like a Researcher174 Questions
Exam 2: The Research Process: Ideas to Innovations173 Questions
Exam 3: Ethics: Making Ethical Decisions in Research178 Questions
Exam 4: The Psychologists Toolbox: Tools for Building Better Designs196 Questions
Exam 5: Qualitative Research: Getting Into the Mind of a Serial Killer171 Questions
Exam 6: Observational Research: the Many Forms of Discipline in Parents Bag of Tricks173 Questions
Exam 7: Survey Design and Scale Construction: Is Going Greek a Great Idea172 Questions
Exam 8: Two-Group Design: Texting: I Cant Get You Out of My Mind177 Questions
Exam 9: Multi-Group Design: Im Feeling Hot, but Is the Earth Hot, Too178 Questions
Exam 10: Within-Subjects Designs: Can Watching Reality Tv Shows Be Good for Us173 Questions
Exam 11: Factorial Design: I Lost My Phone Number, Can I Borrow Yours Do Pickup Lines Really Work176 Questions
Exam 12: Mixed Design: Which Therapy Is Best for Treating Eating Disorders175 Questions
Exam 13: Using Research in the Real World: How Do You Know If You Are Truly Helping172 Questions
Exam 14: a Statistical Tools for Answering Research Questions50 Questions
Select questions type
A 4 × 3 × 2 × 2 × 2 factorial design includes how many levels in the second independent variable?
(Multiple Choice)
4.8/5  (33)
(33)
A 2 × 2 × 4 factorial design includes how many independent variables?
(Multiple Choice)
4.7/5 (30)
Dr. Raqui computed a two-way factorial analysis of variance with types of aggression (relational or overt) and the type of communication method (email, phone, or in-person) as the independent variables and level of self-esteem as the dependent variable. The relational aggression main effect was significant, F(1, 222) = 4.2, p = .001, eta2 = .031. Which of the following represents the F score?
(Multiple Choice)
4.9/5 (37)
Use the following to answer questions
Scenario I
Scenario I is based on fabricated data inspired by the following study:
Hennig-Thurau, T., Groth, M., Paul, M. & Gremler, D. D. (2006). Are all smiles created equal? How emotional contagion and emotional labor affect service relationships. Journal of Marketing, 70, 58-73.
Do Smiling Employees Improve Customer Satisfaction?
In this 2 × 2 between-subjects design, Hennig-Thurau and colleagues examined the effect of employee emotions and authenticity of the emotion on customer relations. A total of 223 undergraduate volunteers participated in this study. The participants were told they would be testing a new movie consulting service. The movie consulting service was created by the experimenters, and actors were hired to act as customer service representatives. Each participant approached the service desk where the actor asked them a number of questions 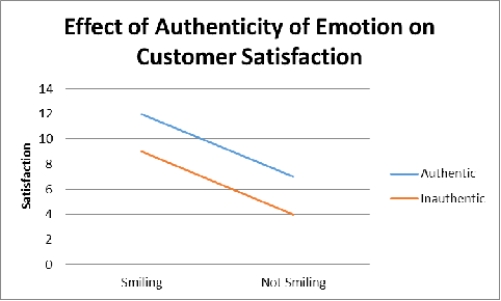 Figure 1. Customers rate their experience more favorably when employees are smiling.
-(Scenario I) Figure 1 supports which of the following hypotheses?
Figure 1. Customers rate their experience more favorably when employees are smiling.
-(Scenario I) Figure 1 supports which of the following hypotheses?
(Multiple Choice)
5.0/5 (36)
Use the following to answer questions
Scenario I
Scenario I is based on fabricated data inspired by the following study:
Hennig-Thurau, T., Groth, M., Paul, M. & Gremler, D. D. (2006). Are all smiles created equal? How emotional contagion and emotional labor affect service relationships. Journal of Marketing, 70, 58-73.
Do Smiling Employees Improve Customer Satisfaction?
In this 2 × 2 between-subjects design, Hennig-Thurau and colleagues examined the effect of employee emotions and authenticity of the emotion on customer relations. A total of 223 undergraduate volunteers participated in this study. The participants were told they would be testing a new movie consulting service. The movie consulting service was created by the experimenters, and actors were hired to act as customer service representatives. Each participant approached the service desk where the actor asked them a number of questions Figure 1. Customers rate their experience more favorably when employees are smiling.
-(Scenario I)How many hypotheses were tested in the study described in Scenario I?
(Multiple Choice)
5.0/5 (38)
Factorial designs have the added benefit of being able to establish:
(Multiple Choice)
4.8/5 (43)
Distinguish between a within-subjects factorial design and a between-subjects factorial design.
(Essay)
4.8/5 (33)
A two-way analysis of variance is a statistical test that allows researchers to simultaneously test how two separate _____ or categorical independent variables influence the _____ variable and how those independent variables interact to influence the dependent variable.
(Multiple Choice)
4.8/5 (30)
Marginal mean refers to the average of all participants on _____ level(s) of the _____ variable.
(Multiple Choice)
4.9/5 (40)
If a factorial design is set up to be a within-subjects design then:
(Multiple Choice)
4.9/5 (39)
In a 2003 study looking at histocompatibility complex genes, symmetry and body scent attractiveness in men and women researchers asked 200 males and females to provide a blood sample to assess their major histocompatibility complex (MHC) gene, then to sleep a new clean T-shirt for two nights. Researchers also took photos of the males and females to document left- and right-side body symmetry. When the participants were asked about attractiveness, their answers indicated that the:
(Multiple Choice)
4.8/5 (39)
Use the following to answer questions
Scenario III
Scenario III is based on fabricated data inspired by the following study:
Spencer, S. J., Steele, C. M. & Quinn, D. M. (1999). Stereotype threat and women's math performance. Journal of Experimental Social Psychology, 35, 4-28.
Effect of Stereotype Threat on Math Study
The myth that men outperform women in math is widely believed by many individuals. The purpose of the study described in Scenario III was to determine if a sample of women whose math abilities equaled a sample of men would fall victim to this threat. To that end, 28 adult men and 28 adult women were administered an easy math test or a difficult math test. The performance of men and women on both the easy and hard test was quantified. A two-factor ANOVA revealed a significant main effect for test, with participants scoring significantly better on the easy test. The analyses also revealed a main effect for sex, with men performing significantly better than women. The interaction between test difficulty and sex was also statistically significant. Further inspection of the data revealed that although men and women did not differ on the easy math test, women performed significantly less well than men on the difficult math test. Given that the screening criteria for participants including earning a grade of B or better in college calculus, and scoring in at least the 85th percentile on the math subsection of the ACT, the current study indicates that women do succumb to math stereotype threat but only when the math challenge is great. The data are presented in Figure 2.
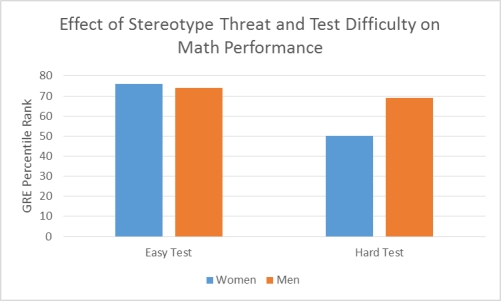 Figure 2. Although women and men performed equally on an easy version of the math test, women performed significantly worse than men on the difficult version.
-(Scenario III) What makes the design in Scenario III a hybrid design?
Figure 2. Although women and men performed equally on an easy version of the math test, women performed significantly worse than men on the difficult version.
-(Scenario III) What makes the design in Scenario III a hybrid design?
(Multiple Choice)
4.9/5 (31)
In factorial design, the number of independent variables indicates the number of potential:
(Multiple Choice)
4.8/5 (38)
In a research scenario where Red Bull alters the manner in which an individual absorbs alcohol into their systems and influences their overall alertness, which variable is the dependent variable?
(Multiple Choice)
4.7/5 (40)
_____ is a prediction that focuses on one independent variable at a time, ignoring all other independent variables.
(Multiple Choice)
4.8/5 (35)
Study interactions permit researchers to mimic the complexity of real life, which also tends to:
(Multiple Choice)
4.7/5 (29)
In a 2 × 2× 3 factorial design how many levels does the second independent variable have?
(Multiple Choice)
5.0/5 (42)
Use the following to answer questions
Scenario III
Scenario III is based on fabricated data inspired by the following study:
Spencer, S. J., Steele, C. M. & Quinn, D. M. (1999). Stereotype threat and women's math performance. Journal of Experimental Social Psychology, 35, 4-28.
Effect of Stereotype Threat on Math Study
The myth that men outperform women in math is widely believed by many individuals. The purpose of the study described in Scenario III was to determine if a sample of women whose math abilities equaled a sample of men would fall victim to this threat. To that end, 28 adult men and 28 adult women were administered an easy math test or a difficult math test. The performance of men and women on both the easy and hard test was quantified. A two-factor ANOVA revealed a significant main effect for test, with participants scoring significantly better on the easy test. The analyses also revealed a main effect for sex, with men performing significantly better than women. The interaction between test difficulty and sex was also statistically significant. Further inspection of the data revealed that although men and women did not differ on the easy math test, women performed significantly less well than men on the difficult math test. Given that the screening criteria for participants including earning a grade of B or better in college calculus, and scoring in at least the 85th percentile on the math subsection of the ACT, the current study indicates that women do succumb to math stereotype threat but only when the math challenge is great. The data are presented in Figure 2.
Figure 2. Although women and men performed equally on an easy version of the math test, women performed significantly worse than men on the difficult version.
-(Scenario III) The study described in Scenario III used a factorial design to examine the effect of sex and test difficulty on math performance. Which of the following is NOT true of factorial designs?
(Multiple Choice)
4.8/5 (39)
In a 2 × 2 factorial design using a within-subjects design:
(Multiple Choice)
4.9/5 (32)
Filters
- Essay(0)
- Multiple Choice(0)
- Short Answer(0)
- True False(0)
- Matching(0)