Exam 11: Factorial Design: I Lost My Phone Number, Can I Borrow Yours Do Pickup Lines Really Work
Exam 1: Psychology As Science: Thinking Like a Researcher174 Questions
Exam 2: The Research Process: Ideas to Innovations173 Questions
Exam 3: Ethics: Making Ethical Decisions in Research178 Questions
Exam 4: The Psychologists Toolbox: Tools for Building Better Designs196 Questions
Exam 5: Qualitative Research: Getting Into the Mind of a Serial Killer171 Questions
Exam 6: Observational Research: the Many Forms of Discipline in Parents Bag of Tricks173 Questions
Exam 7: Survey Design and Scale Construction: Is Going Greek a Great Idea172 Questions
Exam 8: Two-Group Design: Texting: I Cant Get You Out of My Mind177 Questions
Exam 9: Multi-Group Design: Im Feeling Hot, but Is the Earth Hot, Too178 Questions
Exam 10: Within-Subjects Designs: Can Watching Reality Tv Shows Be Good for Us173 Questions
Exam 11: Factorial Design: I Lost My Phone Number, Can I Borrow Yours Do Pickup Lines Really Work176 Questions
Exam 12: Mixed Design: Which Therapy Is Best for Treating Eating Disorders175 Questions
Exam 13: Using Research in the Real World: How Do You Know If You Are Truly Helping172 Questions
Exam 14: a Statistical Tools for Answering Research Questions50 Questions
Select questions type
Previous research has indicated that alcohol decreases motor coordination performance, but when alcohol was combined with an energy drink, individual had increased feelings of stimulation and increased ______ in their performance, although their performance was actually worse.
(Multiple Choice)
5.0/5  (34)
(34)
Use the following to answer questions
Scenario III
Scenario III is based on fabricated data inspired by the following study:
Spencer, S. J., Steele, C. M. & Quinn, D. M. (1999). Stereotype threat and women's math performance. Journal of Experimental Social Psychology, 35, 4-28.
Effect of Stereotype Threat on Math Study
The myth that men outperform women in math is widely believed by many individuals. The purpose of the study described in Scenario III was to determine if a sample of women whose math abilities equaled a sample of men would fall victim to this threat. To that end, 28 adult men and 28 adult women were administered an easy math test or a difficult math test. The performance of men and women on both the easy and hard test was quantified. A two-factor ANOVA revealed a significant main effect for test, with participants scoring significantly better on the easy test. The analyses also revealed a main effect for sex, with men performing significantly better than women. The interaction between test difficulty and sex was also statistically significant. Further inspection of the data revealed that although men and women did not differ on the easy math test, women performed significantly less well than men on the difficult math test. Given that the screening criteria for participants including earning a grade of B or better in college calculus, and scoring in at least the 85th percentile on the math subsection of the ACT, the current study indicates that women do succumb to math stereotype threat but only when the math challenge is great. The data are presented in Figure 2.
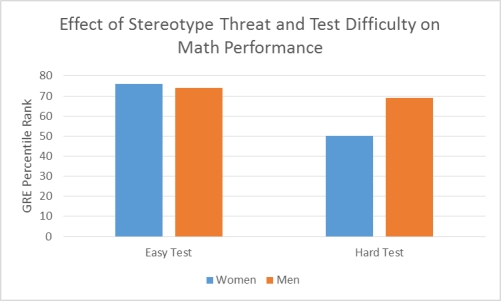 Figure 2. Although women and men performed equally on an easy version of the math test, women performed significantly worse than men on the difficult version.
-(Scenario III) Suppose the researchers described in Scenario III added a third level of difficulty to the math test and added a third variable (time to complete test). Participants were given 1 hour, 2 hours, or 3 hours to complete the test. This design would now produce how many unique treatment conditions?
Figure 2. Although women and men performed equally on an easy version of the math test, women performed significantly worse than men on the difficult version.
-(Scenario III) Suppose the researchers described in Scenario III added a third level of difficulty to the math test and added a third variable (time to complete test). Participants were given 1 hour, 2 hours, or 3 hours to complete the test. This design would now produce how many unique treatment conditions?
(Multiple Choice)
4.8/5 (40)
Each of the following is an example of an interaction, EXCEPT:
(Multiple Choice)
4.9/5 (28)
Hybrid designs include any factorial design that has at least one _____ variable.
(Multiple Choice)
4.9/5 (33)
Researchers in a 2009 study assessed whether participants were accurate in their ability to assess romantic interest by having males and females watch short video clips of couples during a date. The video clips depicted German-speaking couples. Participants viewed 10-second or 30-second video clips of the beginning, middle, or end of the dates. The results revealed:
(Multiple Choice)
4.8/5 (32)
A 3 × 3 × 2 factorial design includes how many levels in the second independent variable?
(Multiple Choice)
4.8/5 (34)
Use the following to answer questions
Scenario I
Scenario I is based on fabricated data inspired by the following study:
Hennig-Thurau, T., Groth, M., Paul, M. & Gremler, D. D. (2006). Are all smiles created equal? How emotional contagion and emotional labor affect service relationships. Journal of Marketing, 70, 58-73.
Do Smiling Employees Improve Customer Satisfaction?
In this 2 × 2 between-subjects design, Hennig-Thurau and colleagues examined the effect of employee emotions and authenticity of the emotion on customer relations. A total of 223 undergraduate volunteers participated in this study. The participants were told they would be testing a new movie consulting service. The movie consulting service was created by the experimenters, and actors were hired to act as customer service representatives. Each participant approached the service desk where the actor asked them a number of questions 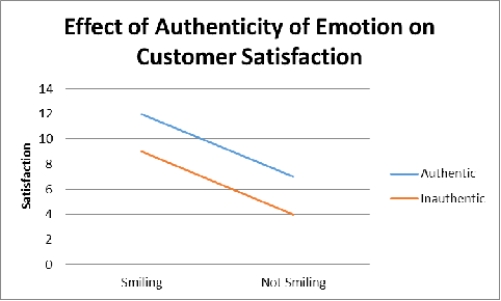 Figure 1. Customers rate their experience more favorably when employees are smiling.
-(Scenario I) The researchers of Scenario I conducted a follow-up study to examine whether customer satisfaction differed based on the smiling of the employee and sex of the participant. This design can be described as:
Figure 1. Customers rate their experience more favorably when employees are smiling.
-(Scenario I) The researchers of Scenario I conducted a follow-up study to examine whether customer satisfaction differed based on the smiling of the employee and sex of the participant. This design can be described as:
(Multiple Choice)
4.9/5 (35)
Tyrese wants to conduct a study on how athletics influence a student's practical cognitive flexibility. Which of the following would be the best for optimizing mundane realism?
(Multiple Choice)
4.9/5 (32)
Cell mean refers to the mean of the _____variables for participants with a specific combination of the levels of the _____.
(Multiple Choice)
4.9/5 (34)
Use the following to answer questions
Scenario II
Scenario II is presents fabricated data inspired by the following study:
Greimel, E., Wanderer, S., Rothenberger, A., Herpertz-Dahlman, B., Konrad, K. & Roessner, V. (2011). Attentional performance in children and adolescents with tic disorder and co-occurring attention-deficit/hyperactivity disorder: new insights from a 2×2 factorial design study. Journal of Abnormal Child Psychology, 39, 819-828.
Effect of Tic Disorder and ADHD on Children's Attention
This study examined the extent to which tic disorder (TD) and attention-deficit/hyperactivity disorder (ADHD), both individually and combined, affects attention in children and adolescents. To that end, the researchers recruited children with and without TD, and children with and without ADHD. This 2 × 2 (TD × ADHD) design resulted in four conditions: children with no diagnosis (control), children with TD only, children with ADHD only, and children with TD+ADHD. The Child Behavior Checklist (CBCL) was used to quantify three components of attentional behavior: internalizing, externalizing, and attention. The results revealed that children with ADHD+TD had significantly more internalizing than those with TD alone. In addition, children with ADHD+TD as well as children with only ADHD had more externalizing than those with TD alone. Lastly, ADHD+TD children had more attention problems than those with only TD and those with only ADHD. The results of this study suggest that children with ADHD+TD have more behavioral problems than those with single diagnoses and those with no diagnoses.
-(Scenario II) The fact that kids with ADHD+TD had significantly more behavioral problems than those with ADHD alone or TD alone suggests a _____ effect.
(Multiple Choice)
4.7/5 (31)
Dr. Clark was lecturing to his statistics course and noted a common misconception about factorial design. He stated that it is very important to remember that main effect and interaction effect hypotheses are _____ each other.
(Multiple Choice)
5.0/5 (23)
An interaction is considered a(n) _____ effect that occurs when combining two or more factors.
(Multiple Choice)
4.7/5 (39)
Tonya developed hypothetical scenarios for her sociology course. Her professor asked to use her descriptions of hypothetical dating scenarios for an upcoming experimental study. What would be the best term to describe Tonya's scenarios? _____________ is when the influence of one independent variable on the other reverses across the levels of the other variable.
(Multiple Choice)
4.8/5 (40)
In a factorial design, the number of independent variables indicates the number of potential main effect hypotheses, and there are as many _____ as you have combination of independent variables.
(Multiple Choice)
4.8/5 (35)
How many possible outcomes, including both main effects and interaction effects, are possible for a factorial design with three independent variables?
(Multiple Choice)
4.9/5 (36)
_____ is any factorial design that has at least one quasi-independent variable.
(Multiple Choice)
4.8/5 (40)
Why would using research confederates be helpful in an experiment?
(Multiple Choice)
4.8/5 (30)
Describe what a two-way analysis of variance is and how it is different from a t-test for dependent means.
(Essay)
4.7/5 (34)
Factorial designs are true experiments in which the researchers manipulate the _____, all of which are between-subjects.
(Multiple Choice)
4.8/5 (31)
Filters
- Essay(0)
- Multiple Choice(0)
- Short Answer(0)
- True False(0)
- Matching(0)