Exam 9: Regression Analysis
Exam 1: Introduction to Modeling and Decision Analysis78 Questions
Exam 2: Introduction to Optimization and Linear Programming76 Questions
Exam 3: Modeling and Solving Lp Problems in a Spreadsheet93 Questions
Exam 4: Sensitivity Analysis and the Simplex Method76 Questions
Exam 5: Network Modeling92 Questions
Exam 6: Integer Linear Programming102 Questions
Exam 7: Goal Programming and Multiple Objective Optimization81 Questions
Exam 8: Nonlinear Programming Evolutionary Optimization87 Questions
Exam 9: Regression Analysis93 Questions
Exam 10: Data Mining125 Questions
Exam 11: Time Series Forecasting125 Questions
Exam 12: Introduction to Simulation Using Analytic Solver Platform85 Questions
Exam 13: Queuing Theory97 Questions
Exam 14: Decision Analysis125 Questions
Exam 15: Project Management Online82 Questions
Select questions type
Exhibit 9.4
The following questions are based on the problem description and spreadsheet below.
A charitable organization wants to determine what type of people donate to charities like itself. The charity felt that a person's education (in years), annual income, ($1,000) and the number of children the person had were important variables to consider. The charity developed regression models for all of the possible combinations of these three variables but does not know what to do with the results. 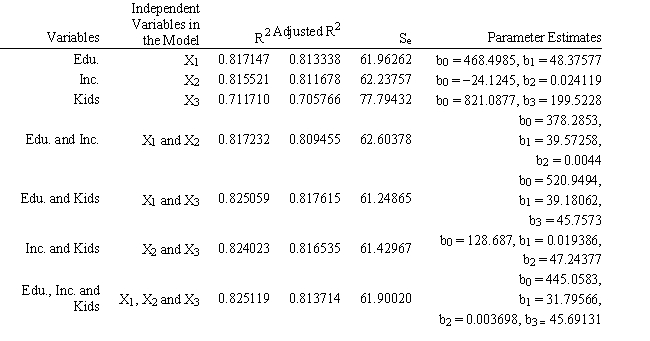 -Refer to Exhibit 9.4. Based on the data in the table which is the best model for the charity to use? Explain which values you used to reach your conclusion.
(Essay)
4.9/5  (22)
(22)
The company would like to build a prediction interval on the time for a new batch of 8 parts. What formula should be entered in cells B17:F21 of the following spreadsheet to compute this prediction interval? Partial results of the Regression analysis of the data are provided below. 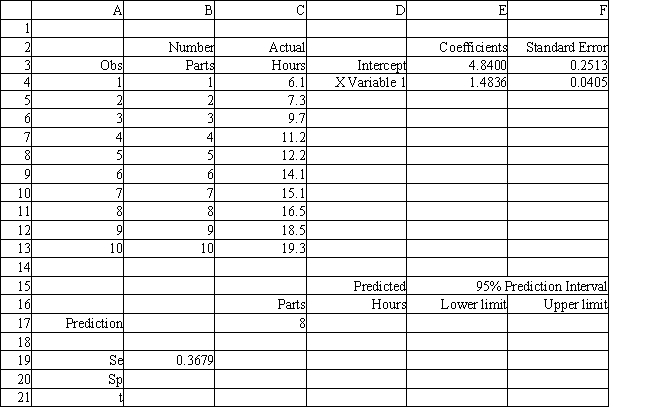
(Essay)
4.8/5 (35)
Exhibit 9.3
The following questions are based on the problem description and spreadsheet below.
A researcher is interested in determining how many calories young men consume. She measured the age of the individuals and recorded how much food they ate each day for a month. The average daily consumption was recorded as the dependent variable. She has developed the following Excel spreadsheet of the results. 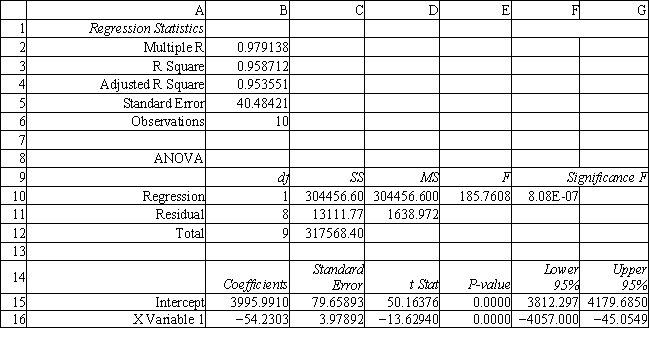 -Refer to Exhibit 9.3. What is the estimated regression function for this problem? Explain what the terms in your equation mean
(Essay)
4.9/5 (35)
Exhibit 9.2
The following questions are based on the problem description and spreadsheet below.
A paint manufacturer is interested in knowing how much pressure (in pounds per square inch, PSI) builds up inside aerosol cans at various temperatures (degrees Fahrenheit). It has developed the following Excel spreadsheet of the results. 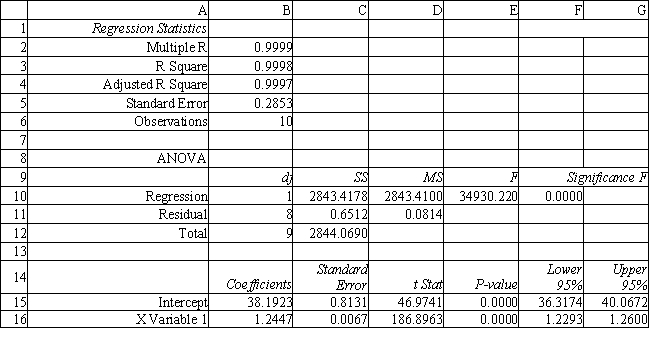 -Refer to Exhibit 9.2. Interpret the meaning of the "Lower 95%" and "Upper 95%" terms in cells F16:G16 of the spreadsheet.
(Essay)
4.7/5 (39)
Exhibit 9.5
The following questions are based on the description and spreadsheet below.
An analyst has identified 3 independent variables (X1, X2,X3) which might be used to predict Y. He has computed the regression equations using all of the variables and the results are summarized in the following table. 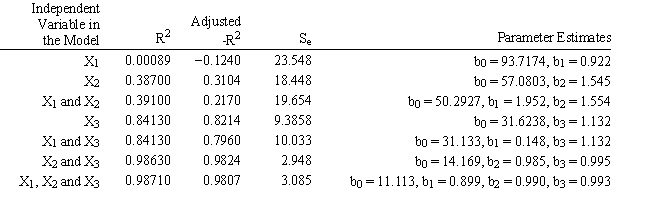 -Refer to Exhibit 9.5. Predict the mean value based on (X1, X2, X3) = (3, 32, 50). Use the best predictive model based on data from the table.
(Essay)
4.8/5 (30)
A pattern resulting from random variation or unexplained causes is called
(Multiple Choice)
4.7/5 (34)
When using the Regression tool in Excel the independent variable is entered as the
(Multiple Choice)
4.7/5 (39)
Exhibit 9.2
The following questions are based on the problem description and spreadsheet below.
A paint manufacturer is interested in knowing how much pressure (in pounds per square inch, PSI) builds up inside aerosol cans at various temperatures (degrees Fahrenheit). It has developed the following Excel spreadsheet of the results.  -Refer to Exhibit 9.2. What is the estimated regression function for this problem? Explain what the terms in your equation mean.
(Essay)
4.8/5 (38)
Exhibit 9.1
The following questions are based on the problem description and spreadsheet below.
A company has built a regression model to predict the number of labor hours (Yi) required to process a batch of parts (Xi). It has developed the following Excel spreadsheet of the results. 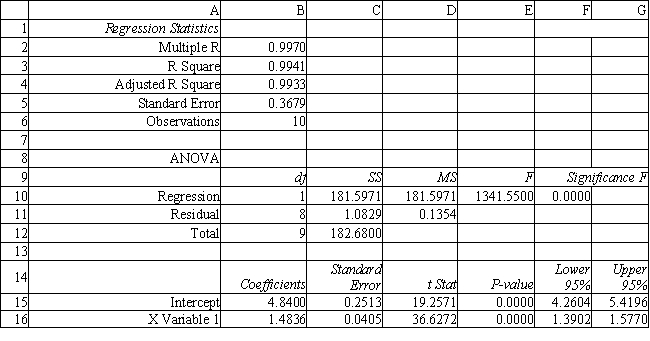 -Refer to Exhibit 9.1. What is the estimated regression function for this problem? Explain what the terms in your equation mean.
(Essay)
4.9/5 (39)
Exhibit 9.1
The following questions are based on the problem description and spreadsheet below.
A company has built a regression model to predict the number of labor hours (Yi) required to process a batch of parts (Xi). It has developed the following Excel spreadsheet of the results.  -Refer to Exhibit 9.1. Provide a rough 95% confidence interval on the number of labor hours for a batch of 5 parts.
(Essay)
4.9/5 (29)
Exhibit 9.1
The following questions are based on the problem description and spreadsheet below.
A company has built a regression model to predict the number of labor hours (Yi) required to process a batch of parts (Xi). It has developed the following Excel spreadsheet of the results.
-Refer to Exhibit 9.1. Test the significance of the model and explain which values you used to reach your conclusions.
(Essay)
4.7/5 (29)
What goodness-of-fit measure is commonly used to evaluate a multiple regression function?
(Multiple Choice)
4.8/5 (31)
The regression line denotes the ____ between the dependent and independent variables.
(Multiple Choice)
4.7/5 (41)
Filters
- Essay(0)
- Multiple Choice(0)
- Short Answer(0)
- True False(0)
- Matching(0)