Exam 9: Regression Analysis
Exam 1: Introduction to Modeling and Decision Analysis78 Questions
Exam 2: Introduction to Optimization and Linear Programming76 Questions
Exam 3: Modeling and Solving Lp Problems in a Spreadsheet93 Questions
Exam 4: Sensitivity Analysis and the Simplex Method76 Questions
Exam 5: Network Modeling92 Questions
Exam 6: Integer Linear Programming102 Questions
Exam 7: Goal Programming and Multiple Objective Optimization81 Questions
Exam 8: Nonlinear Programming Evolutionary Optimization87 Questions
Exam 9: Regression Analysis93 Questions
Exam 10: Data Mining125 Questions
Exam 11: Time Series Forecasting125 Questions
Exam 12: Introduction to Simulation Using Analytic Solver Platform85 Questions
Exam 13: Queuing Theory97 Questions
Exam 14: Decision Analysis125 Questions
Exam 15: Project Management Online82 Questions
Select questions type
Which of the following is an advantage of using the TREND() function versus the regression tool?
(Multiple Choice)
4.8/5  (32)
(32)
Exhibit 9.3
The following questions are based on the problem description and spreadsheet below.
A researcher is interested in determining how many calories young men consume. She measured the age of the individuals and recorded how much food they ate each day for a month. The average daily consumption was recorded as the dependent variable. She has developed the following Excel spreadsheet of the results. 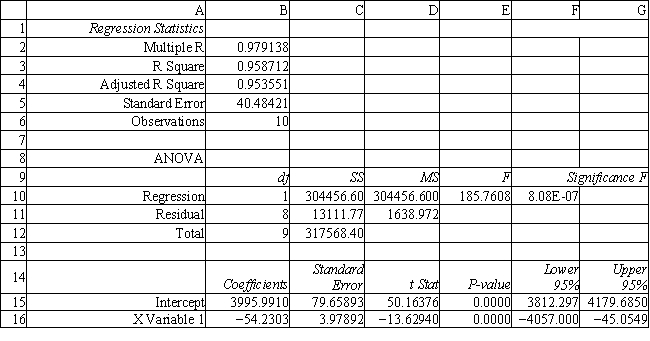 -Refer to Exhibit 9.3. Test the significance of the model and explain which values you used to reach your conclusions.
(Essay)
4.7/5 (37)
Exhibit 9.6
The partial regression output below applies to the following questions. 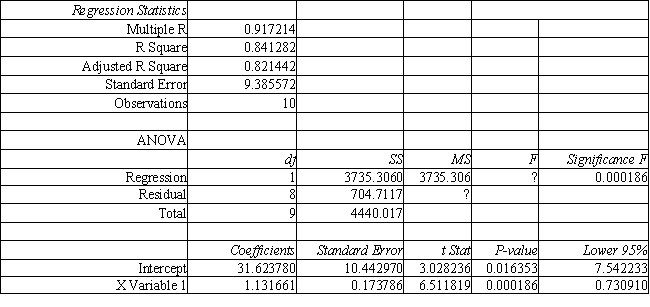 -Refer to Exhibit 9.6. What is the F-statistic value?
(Short Answer)
4.9/5 (36)
Exhibit 9.5
The following questions are based on the description and spreadsheet below.
An analyst has identified 3 independent variables (X1, X2,X3) which might be used to predict Y. He has computed the regression equations using all of the variables and the results are summarized in the following table. 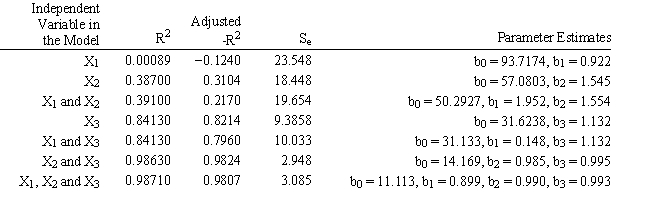 -Refer to Exhibit 9.5. Based on the data in the table which is the best model for the charity to use? Explain which values you used to reach your conclusion.
(Essay)
4.9/5 (30)
Exhibit 9.3
The following questions are based on the problem description and spreadsheet below.
A researcher is interested in determining how many calories young men consume. She measured the age of the individuals and recorded how much food they ate each day for a month. The average daily consumption was recorded as the dependent variable. She has developed the following Excel spreadsheet of the results.  -Refer to Exhibit 9.3. Predict the mean number of calories consumed by a 19 year old man.
(Essay)
4.9/5 (23)
In regression analysis, we consider models of the form: Y = f(X1, X2, ..., Xk) +
(True/False)
4.9/5 (32)
How many independent variables are there in simple regression analysis?
(Multiple Choice)
4.9/5 (35)
Filters
- Essay(0)
- Multiple Choice(0)
- Short Answer(0)
- True False(0)
- Matching(0)