Exam 9: Regression Analysis
Exam 1: Introduction to Modeling and Decision Analysis78 Questions
Exam 2: Introduction to Optimization and Linear Programming76 Questions
Exam 3: Modeling and Solving Lp Problems in a Spreadsheet93 Questions
Exam 4: Sensitivity Analysis and the Simplex Method76 Questions
Exam 5: Network Modeling92 Questions
Exam 6: Integer Linear Programming102 Questions
Exam 7: Goal Programming and Multiple Objective Optimization81 Questions
Exam 8: Nonlinear Programming Evolutionary Optimization87 Questions
Exam 9: Regression Analysis93 Questions
Exam 10: Data Mining125 Questions
Exam 11: Time Series Forecasting125 Questions
Exam 12: Introduction to Simulation Using Analytic Solver Platform85 Questions
Exam 13: Queuing Theory97 Questions
Exam 14: Decision Analysis125 Questions
Exam 15: Project Management Online82 Questions
Select questions type
Exhibit 9.2
The following questions are based on the problem description and spreadsheet below.
A paint manufacturer is interested in knowing how much pressure (in pounds per square inch, PSI) builds up inside aerosol cans at various temperatures (degrees Fahrenheit). It has developed the following Excel spreadsheet of the results. 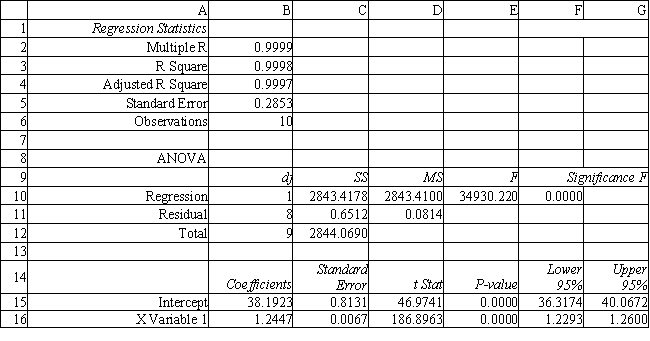 -Refer to Exhibit 9.2. Interpret the meaning of R Square in cell B3 of the spreadsheet.
(Essay)
4.9/5  (35)
(35)
Assume you have chosen to use all three variables in your model. Test the significance of the model and explain which values you used to reach your conclusion. 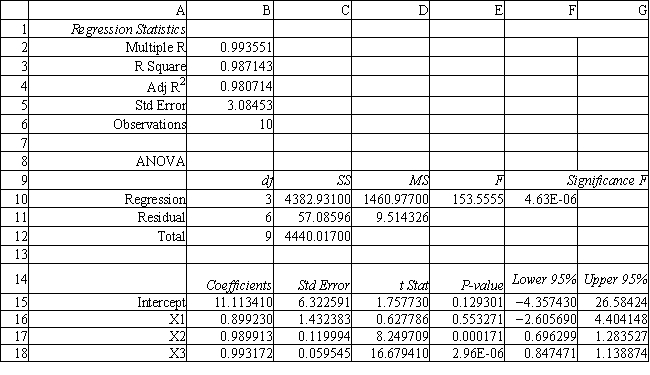
(Essay)
4.8/5 (28)
How many binary variables are required to encode a person's age group as being either young, middle-age or old? What are the variables and what are the meanings of their 0, 1 values?
(Essay)
4.9/5 (35)
In regression modeling, the objective is to determines the values of model coefficients that minimize the sum of squared estimation errors, or error sum of squares (ESS).
(True/False)
4.9/5 (30)
The error sum of squares term is used as a criterion for determining b0 and b1 because
(Multiple Choice)
4.8/5 (33)
Exhibit 9.1
The following questions are based on the problem description and spreadsheet below.
A company has built a regression model to predict the number of labor hours (Yi) required to process a batch of parts (Xi). It has developed the following Excel spreadsheet of the results. 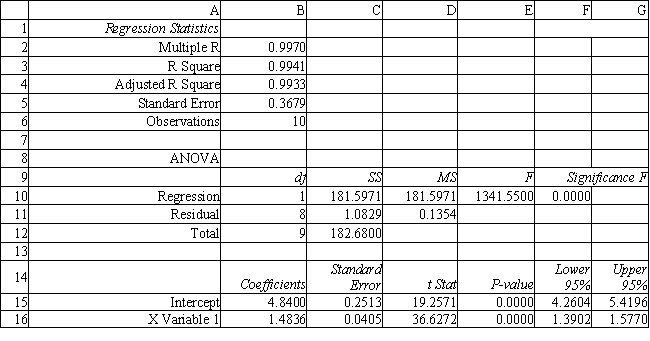 -Refer to Exhibit 9.1. Interpret the meaning of R Square in cell B3 of the spreadsheet.
(Essay)
5.0/5 (32)
The method of least squares finds estimates of parameter values that minimize:
(Multiple Choice)
4.8/5 (41)
Exhibit 9.4
The following questions are based on the problem description and spreadsheet below.
A charitable organization wants to determine what type of people donate to charities like itself. The charity felt that a person's education (in years), annual income, ($1,000) and the number of children the person had were important variables to consider. The charity developed regression models for all of the possible combinations of these three variables but does not know what to do with the results. 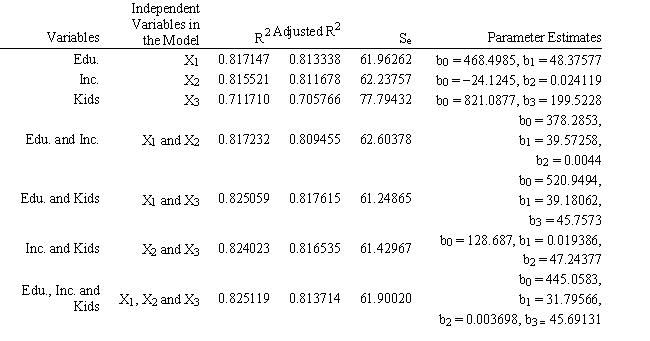 -Refer to Exhibit 9.4. Predict the mean donation by a person with 16 years of education, $90,000 annual income and 2 children. Use a full model based on data from the table.
(Essay)
4.9/5 (41)
For a simple linear regression model, a 100(1 − α)% prediction interval for a new value of Y when X = Xh is computed as
(Multiple Choice)
4.9/5 (42)
Exhibit 9.2
The following questions are based on the problem description and spreadsheet below.
A paint manufacturer is interested in knowing how much pressure (in pounds per square inch, PSI) builds up inside aerosol cans at various temperatures (degrees Fahrenheit). It has developed the following Excel spreadsheet of the results.  -Refer to Exhibit 9.2. Predict the mean pressure for a temperature of 120 degrees.
(Essay)
4.8/5 (33)
An analyst has identified 3 independent variables (X1, X2, X3) which might be used to predict Y. He has computed the regression equations using all combinations of the variables and the results are summarized in the following table. Which combination of variables provides the best regression results? 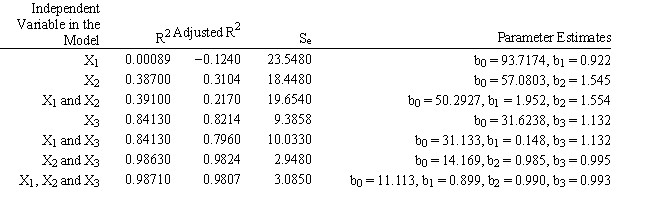
(Multiple Choice)
4.9/5 (35)
In a model: Yi = 0 + 1X1i + i , the terms 0 and 1 are referred to as sample statistics.
(True/False)
4.8/5 (22)
Why do we create a scatter plot of the data in regression analysis?
(Multiple Choice)
4.8/5 (24)
Filters
- Essay(0)
- Multiple Choice(0)
- Short Answer(0)
- True False(0)
- Matching(0)