Exam 3: Describing Data Visually
Exam 1: Overview of Statistics54 Questions
Exam 2: Data Collection113 Questions
Exam 3: Describing Data Visually108 Questions
Exam 4: Descriptive Statistics156 Questions
Exam 5: Probability114 Questions
Exam 6: Discrete Probability Distributions111 Questions
Exam 7: Continuous Probability Distributions114 Questions
Exam 8: Sampling Distributions and Estimation107 Questions
Exam 9: One-Sample Hypothesis Tests135 Questions
Exam 10: Two-Sample Hypothesis Tests116 Questions
Exam 11: Analysis of Variance95 Questions
Exam 12: Simple Regression141 Questions
Exam 13: Multiple Regression133 Questions
Exam 14: Chi-Square Tests95 Questions
Select questions type
Briefly list strengths and weaknesses of this display.Cite specific principles of good graphs,as well as offering your own general interpretation. 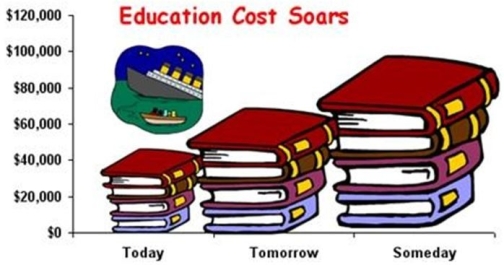
(Essay)
5.0/5  (37)
(37)
A study found the following parts per billion of nitrosamines in a sample of domestic beers.(a)Construct a frequency distribution of four classes with equal class sizes.(b)Construct another frequency distribution of four classes using unequal class intervals or an open-ended interval for the highest class.(c)Which frequency distribution is preferable? Why?

(Essay)
4.9/5 (36)
Briefly list strengths and weaknesses of this display.Cite specific principles of good graphs,as well as offering your own general interpretation. 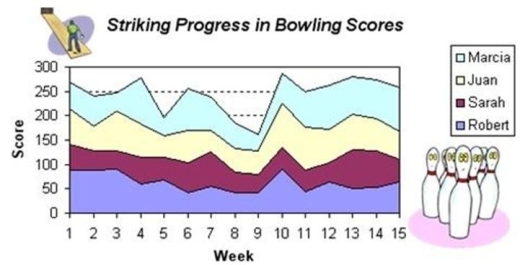
(Essay)
4.9/5 (42)
If you have 256 data points,how many classes (bins)would Sturges' Rule suggest?
(Multiple Choice)
4.8/5 (34)
Excel's pyramid chart is generally preferred to a plain 2D column chart.
(True/False)
4.9/5 (37)
Briefly list strengths and weaknesses of this display.Cite specific principles of good graphs,as well as offering your own general interpretation. 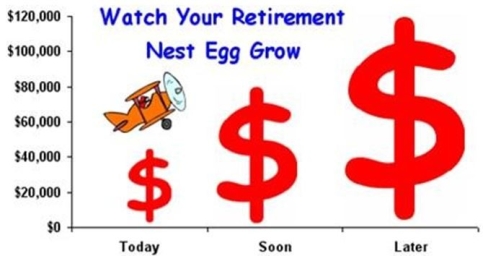
(Essay)
4.8/5 (34)
Briefly list strengths and weaknesses of this display.Cite specific principles of good graphs,as well as offering your own general interpretation. 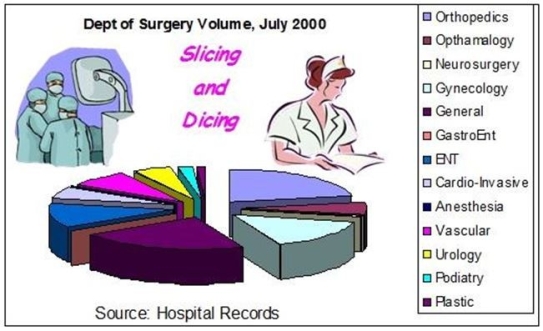
(Essay)
4.8/5 (40)
Sturges' Rule should override judgment about the "right" number of histogram bins.
(True/False)
4.8/5 (41)
Briefly list strengths and weaknesses of this display.Cite specific principles of good graphs,as well as offering your own general interpretation. 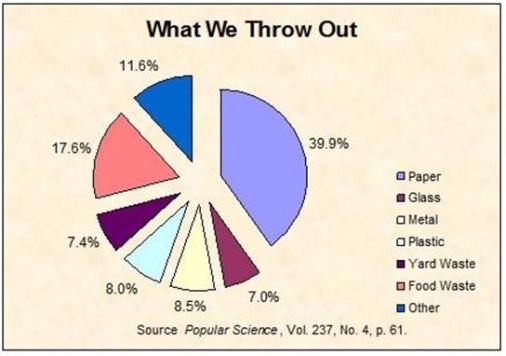
(Essay)
4.8/5 (38)
Below is a sorted stem-and-leaf diagram for the measured speeds (miles per hour)of 49 randomly chosen vehicles on highway I-80 in Nebraska.What is the highest observed speed? 
(Multiple Choice)
4.9/5 (36)
Ten part-time servers at a high-end restaurant were asked how many hours they worked last week and how much they earned.The results are shown below.(a)Make a scatter plot.(b)Describe it.(c)What is your best guess of the average hourly pay?

(Essay)
4.9/5 (46)
Which criterion is least likely to be used in choosing bins (classes)in a frequency distribution?
(Multiple Choice)
4.8/5 (37)
The Pareto chart is used to display the "vital few" causes of problems.
(True/False)
4.8/5 (37)
When using a dot plot with a small sample,which is least apparent?
(Multiple Choice)
4.7/5 (45)
Bob found an error in the following frequency distribution.What is it? 
(Multiple Choice)
4.8/5 (39)
Filters
- Essay(0)
- Multiple Choice(0)
- Short Answer(0)
- True False(0)
- Matching(0)