Exam 3: Describing Data Visually
Exam 1: Overview of Statistics54 Questions
Exam 2: Data Collection113 Questions
Exam 3: Describing Data Visually108 Questions
Exam 4: Descriptive Statistics156 Questions
Exam 5: Probability114 Questions
Exam 6: Discrete Probability Distributions111 Questions
Exam 7: Continuous Probability Distributions114 Questions
Exam 8: Sampling Distributions and Estimation107 Questions
Exam 9: One-Sample Hypothesis Tests135 Questions
Exam 10: Two-Sample Hypothesis Tests116 Questions
Exam 11: Analysis of Variance95 Questions
Exam 12: Simple Regression141 Questions
Exam 13: Multiple Regression133 Questions
Exam 14: Chi-Square Tests95 Questions
Select questions type
Compared to a dot plot,we lose some detail when we present data in a frequency distribution.
(True/False)
4.8/5  (42)
(42)
Which of these deficiencies would be considered a major graphical deception?
(Multiple Choice)
4.7/5 (42)
Briefly list strengths and weaknesses of this display.Cite specific principles of good graphs,as well as offering your own general interpretation. 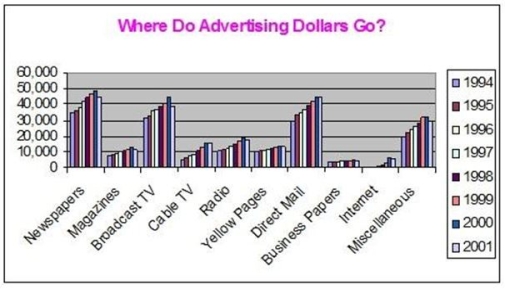
(Essay)
4.8/5 (27)
The width of a class in a frequency distribution is known as the
(Multiple Choice)
4.7/5 (40)
A scatter plot requires two quantitative variables (i.e. ,not categorical data).
(True/False)
4.9/5 (38)
Filters
- Essay(0)
- Multiple Choice(0)
- Short Answer(0)
- True False(0)
- Matching(0)