Exam 3: Descriptive Statistics: Numerical Measures
Exam 1: Data and Statistics84 Questions
Exam 2: Descriptive Statistics: Tabular and Graphical Presentations116 Questions
Exam 3: Descriptive Statistics: Numerical Measures130 Questions
Exam 4: Introduction to Probability127 Questions
Exam 5: Discrete Probability Distributions146 Questions
Exam 6: Continuous Probability Distributions138 Questions
Exam 7: Sampling and Sampling Distributions123 Questions
Exam 8: Interval Estimation111 Questions
Exam 9: Hypothesis Tests117 Questions
Exam 10: Comparisons Involving Means, Experimental Design, and Analysis of Variance184 Questions
Exam 11: Comparisons Involving Proportions and a Test of Independence117 Questions
Exam 12: Simple Linear Regression107 Questions
Exam 13: Multiple Regression111 Questions
Exam 14: Statistical Methods for Quality Control72 Questions
Exam 15: Time Series Analysis and Forecastng75 Questions
Select questions type
The descriptive measure that is not measured in the same units as the original data is the
(Multiple Choice)
4.8/5  (30)
(30)
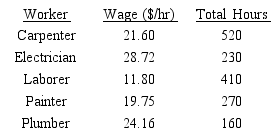
Ron Butler, a custom home builder, is looking over the expenses he incurred for a house he just completed constructing. For the purpose of pricing future construction projects, he would like to know the average wage ($/hour) he paid the workers he employed. Listed below are the categories of worker he employed, along with their respective wage and total hours worked. What is the average wage ($/hour) he paid the workers?
(Short Answer)
4.8/5 (34)
Excel's __________ function can be used to compute the mode.
(Multiple Choice)
4.7/5 (43)
The annual part-time earnings of a sample of college students are given below.  A)Compute the mean.
B)Compute the variance.
C)Compute the standard deviation.
D)Compute the coefficient of variation.
A)Compute the mean.
B)Compute the variance.
C)Compute the standard deviation.
D)Compute the coefficient of variation.
(Short Answer)
4.7/5 (32)
The __________ denotes the number of standard deviations xi is from the mean  .
.
(Multiple Choice)
4.9/5 (31)
An important numerical measure of the shape of a distribution is the
(Multiple Choice)
4.9/5 (32)
Exhibit 3-2
A researcher has collected the following sample data. The mean of the sample is 5.
 -Refer to Exhibit 3-2. The coefficient of variation is
(Multiple Choice)
4.9/5 (35)
A numerical measure of linear association between two variables is the
(Multiple Choice)
4.8/5 (34)
Exhibit 3-3
Suppose annual salaries for sales associates from a particular store have a bell-shaped distribution with a mean of $32,500 and a standard deviation of $2,500.
-Refer to Exhibit 3-3. The z-score for a sales associate from this store who earns $37,500 is
(Multiple Choice)
4.8/5 (33)
__________ can be used to determine the percentage of data values that must be within one, two, and three standard deviations of the mean for data having a bell-shaped distribution.
(Multiple Choice)
5.0/5 (35)
Exhibit 3-1
A researcher has collected the following sample data.
 -Refer to Exhibit 3-1. The mean is
(Multiple Choice)
4.9/5 (37)
A numerical measure computed from a sample, such as sample mean, is known as a
(Multiple Choice)
4.7/5 (32)
The standard deviation of a sample of 100 observations equals 64. The variance of the sample equals
(Multiple Choice)
4.9/5 (44)
Excel's __________ function can be used to compute the median.
(Multiple Choice)
4.7/5 (32)
Exhibit 3-2
A researcher has collected the following sample data. The mean of the sample is 5.
-Refer to Exhibit 3-2. The range is
(Multiple Choice)
4.8/5 (32)
Filters
- Essay(0)
- Multiple Choice(0)
- Short Answer(0)
- True False(0)
- Matching(0)