Exam 10: Comparisons Involving Means, Experimental Design, and Analysis of Variance
Exam 1: Data and Statistics84 Questions
Exam 2: Descriptive Statistics: Tabular and Graphical Presentations116 Questions
Exam 3: Descriptive Statistics: Numerical Measures130 Questions
Exam 4: Introduction to Probability127 Questions
Exam 5: Discrete Probability Distributions146 Questions
Exam 6: Continuous Probability Distributions138 Questions
Exam 7: Sampling and Sampling Distributions123 Questions
Exam 8: Interval Estimation111 Questions
Exam 9: Hypothesis Tests117 Questions
Exam 10: Comparisons Involving Means, Experimental Design, and Analysis of Variance184 Questions
Exam 11: Comparisons Involving Proportions and a Test of Independence117 Questions
Exam 12: Simple Linear Regression107 Questions
Exam 13: Multiple Regression111 Questions
Exam 14: Statistical Methods for Quality Control72 Questions
Exam 15: Time Series Analysis and Forecastng75 Questions
Select questions type
An ANOVA procedure is used for data obtained from five populations. Five samples, each comprised of 20 observations, were taken from the five populations. The numerator and denominator (respectively) degrees of freedom for the critical value of F are
Free
(Multiple Choice)
4.8/5  (24)
(24)
Correct Answer: Verified
D
The test statistic F is the ratio
Free
(Multiple Choice)
4.8/5 (30)
Correct Answer:Verified
B
Exhibit 10-1
Salary information regarding male and female employees of a large company is shown below.
 -Refer to Exhibit 10-1. The standard error for the difference between the two means is
Free
(Multiple Choice)
4.8/5 (34)
Correct Answer:Verified
D
Zip, Inc. manufactures Zip drives on two different manufacturing processes. Because the management of this company is interested in determining if process 1 takes less manufacturing time, they selected independent samples from each process. The results of the samples are shown below.
 a.State the null and alternative hypotheses.
b.Determine the degrees of freedom for the t test.
c.Compute the test statistic
d.At 95% confidence, test to determine if there is sufficient evidence to indicate that process 1 takes a significantly shorter time to manufacture the Zip drives.
a.State the null and alternative hypotheses.
b.Determine the degrees of freedom for the t test.
c.Compute the test statistic
d.At 95% confidence, test to determine if there is sufficient evidence to indicate that process 1 takes a significantly shorter time to manufacture the Zip drives.
(Essay)
4.8/5 (20)
In order to test to see if there is any significant difference in the mean number of units produced per week by each of three production methods, the following data were collected:
 a.Compute the overall sample mean.
b.At the 0.05 level of significance, is there any difference in the mean number of units produced per week by each method? Show the complete ANOVA table. Note that the sample sizes are not equal.
a.Compute the overall sample mean.
b.At the 0.05 level of significance, is there any difference in the mean number of units produced per week by each method? Show the complete ANOVA table. Note that the sample sizes are not equal.
(Essay)
5.0/5 (34)
If we reject the hypothesis H0: 1 = 2 = 3, we can conclude that
(Multiple Choice)
4.8/5 (37)
In order to estimate the difference between the average yearly salaries of top managers in private and governmental organizations, the following information was gathered.
 Develop an interval estimate for the difference between the average salaries of the two sectors. Let .05.
(Short Answer)
4.9/5 (29)
Three different brands of tires were compared for wear characteristics. From each brand of tire, ten tires were randomly selected and subjected to standard wear-testing procedures. The average mileage obtained for each brand of tire and sample variances (both in 1,000 miles) are shown below.
 At 95% confidence, test to see if there is a significant difference in the average mileage of the three brands.
(Essay)
4.8/5 (39)
Exhibit 10-5
The following information was obtained from matched samples.
 -Refer to Exhibit 10-5. The null hypothesis tested is H0: d 0. The test statistic for the difference between the two population means is
(Multiple Choice)
4.9/5 (38)
Exhibit 10-4
The following information was obtained from independent random samples.
Assume normally distributed populations with equal variances.
 -Refer to Exhibit 10-4. The degrees of freedom for the t distribution are
(Multiple Choice)
4.7/5 (32)
Independent samples of commuters are taken from two cities. The following data represents the time (in minutes) to drive to work. Use Excel to determine whether the average commuting times are significantly different between the two cities. Use .05.

(Essay)
4.7/5 (27)
The business manager of a local health clinic is interested in estimating the difference between the fees for extended office visits in her center and the fees of a newly opened group practice. She gathered the following information regarding the two offices.
 Develop a 95% confidence interval estimate for the difference between the average fees of the two offices.
(Short Answer)
4.8/5 (36)
At 0.05, test to determine if the means of the three populations (from which the following samples are selected) are equal. Show the complete ANOVA table.

(Essay)
4.8/5 (34)
In testing for the equality of k population means, the number of treatments is
(Multiple Choice)
4.9/5 (37)
The following sample information is given concerning the ACT scores of high school seniors form two local schools.
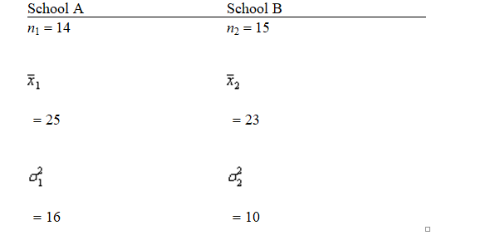 Develop a 95% confidence interval estimate for the difference between the two populations.
(Short Answer)
4.9/5 (26)
Exhibit 10-15
The following is part of an ANOVA table that was obtained from data regarding three treatments and a total of 15 observations.
 -Refer to Exhibit 10-15. The number of degrees of freedom corresponding to within treatments is
(Multiple Choice)
4.8/5 (38)
Exhibit 10-3
A statistics teacher wants to see if there is any difference in the abilities of students enrolled in statistics today and those enrolled five years ago. A sample of final examination scores from students enrolled today and from students enrolled five years ago was taken. You are given the following information.
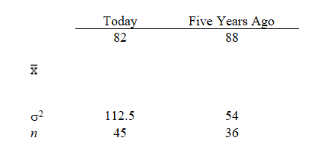 -Refer to Exhibit 10-3. The 95% confidence interval for the difference between the two population means is
(Multiple Choice)
4.9/5 (33)
Recently, a local newspaper reported that part time students are older than full time students. In order to test the validity of its statement, two independent samples of students were selected.
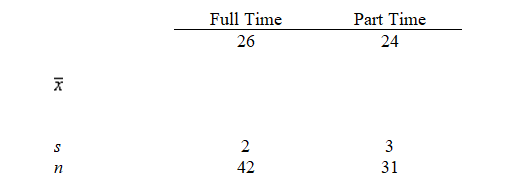 a.Give the hypotheses for the above.
b.Determine the degrees of freedom.
c.Compute the test statistic.
d.At 95% confidence, test to determine whether or not the average age of part time students is significantly more than full time students.
a.Give the hypotheses for the above.
b.Determine the degrees of freedom.
c.Compute the test statistic.
d.At 95% confidence, test to determine whether or not the average age of part time students is significantly more than full time students.
(Essay)
4.7/5 (34)
Exhibit 10-9
Two major automobile manufacturers have produced compact cars with the same size engines. We are interested in determining whether or not there is a significant difference in the MPG (miles per gallon) of the two brands of automobiles. A random sample of eight cars from each manufacturer is selected, and eight drivers are selected to drive each automobile for a specified distance. The following data show the results of the test.
 -Refer to Exhibit 10-9. The mean for the differences is
(Multiple Choice)
4.7/5 (40)
In analysis of variance, the levels of the factor are called the
(Multiple Choice)
4.9/5 (35)
Filters
- Essay(0)
- Multiple Choice(0)
- Short Answer(0)
- True False(0)
- Matching(0)