Exam 2: Descriptive Statistics: Tabular and Graphical Presentations
Exam 1: Data and Statistics84 Questions
Exam 2: Descriptive Statistics: Tabular and Graphical Presentations116 Questions
Exam 3: Descriptive Statistics: Numerical Measures130 Questions
Exam 4: Introduction to Probability127 Questions
Exam 5: Discrete Probability Distributions146 Questions
Exam 6: Continuous Probability Distributions138 Questions
Exam 7: Sampling and Sampling Distributions123 Questions
Exam 8: Interval Estimation111 Questions
Exam 9: Hypothesis Tests117 Questions
Exam 10: Comparisons Involving Means, Experimental Design, and Analysis of Variance184 Questions
Exam 11: Comparisons Involving Proportions and a Test of Independence117 Questions
Exam 12: Simple Linear Regression107 Questions
Exam 13: Multiple Regression111 Questions
Exam 14: Statistical Methods for Quality Control72 Questions
Exam 15: Time Series Analysis and Forecastng75 Questions
Select questions type
Fill in the missing value for the following relative frequency distribution.

Free
(Short Answer)
4.7/5  (40)
(40)
Correct Answer: Verified
0.080
The total number of data items with a value less than or equal to the upper limit for the class is given by the
Free
(Multiple Choice)
4.9/5 (40)
Correct Answer:Verified
C
Exhibit 2-3
The number of sick days taken (per month) by 200 factory workers is summarized below.
 -Refer to Exhibit 2-3. The percentage of workers who took 0 - 5 sick days per month was
Free
(Multiple Choice)
5.0/5 (40)
Correct Answer:Verified
D
Exhibit 2-3
The number of sick days taken (per month) by 200 factory workers is summarized below.
-Refer to Exhibit 2-3. The number of workers who took less than 11 sick days per month
(Multiple Choice)
4.8/5 (37)
What type of relationship is depicted in the following scatter diagram? 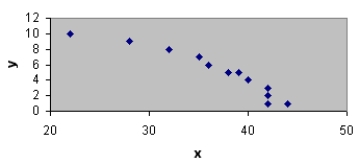
(Short Answer)
4.7/5 (29)
Excel's __________ can be used to construct a scatter diagram.
(Multiple Choice)
4.7/5 (30)
Fifteen percent of the students in a School of Business Administration are majoring in Economics, 20% in Finance, 35% in Management, and 30% in Accounting. The graphical device(s) that can be used to present these data is (are)
(Multiple Choice)
4.9/5 (41)
Data that provide labels or names for groupings of like items are known as
(Multiple Choice)
4.8/5 (32)
A histogram is not appropriate for displaying which of the following types of information?
(Multiple Choice)
4.9/5 (40)
Fill in the missing value for the following percent frequency distribution.

(Short Answer)
4.8/5 (43)
If several frequency distributions are constructed from the same data set, the distribution with the widest class width will have the
(Multiple Choice)
4.8/5 (33)
In a cumulative percent frequency distribution, the last class will have a cumulative percent frequency equal to
(Multiple Choice)
4.8/5 (31)
A tabular summary of a set of data showing the fraction of the total number of items in several nonoverlapping classes is a
(Multiple Choice)
4.8/5 (34)
Exhibit 2-3
The number of sick days taken (per month) by 200 factory workers is summarized below.
-Refer to Exhibit 2-3. The number of workers who took at least 11 sick days per month
(Multiple Choice)
4.7/5 (37)
Excel's __________ can be used to construct a crosstabulation.
(Multiple Choice)
4.8/5 (36)
Exhibit 2-3
The number of sick days taken (per month) by 200 factory workers is summarized below.
-Refer to Exhibit 2-3. The relative frequency of workers who took 10 or fewer sick days
(Multiple Choice)
4.9/5 (36)
What type of relationship is depicted in the following scatter diagram? 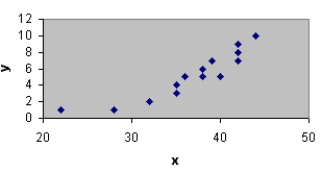
(Short Answer)
4.8/5 (36)
The following is a summary of the number of hours spent per day watching television for a sample of 100 people. What is wrong with the frequency distribution?

(Short Answer)
4.9/5 (37)
Exhibit 2-3
The number of sick days taken (per month) by 200 factory workers is summarized below.
-Refer to Exhibit 2-3. The class width for this distribution
(Multiple Choice)
4.9/5 (36)
To construct a histogram using Excel's Chart Tools, choose __________ as the chart type.
(Multiple Choice)
4.9/5 (34)
Filters
- Essay(0)
- Multiple Choice(0)
- Short Answer(0)
- True False(0)
- Matching(0)