Exam 2: Descriptive Statistics: Tabular and Graphical Presentations
Exam 1: Data and Statistics84 Questions
Exam 2: Descriptive Statistics: Tabular and Graphical Presentations116 Questions
Exam 3: Descriptive Statistics: Numerical Measures130 Questions
Exam 4: Introduction to Probability127 Questions
Exam 5: Discrete Probability Distributions146 Questions
Exam 6: Continuous Probability Distributions138 Questions
Exam 7: Sampling and Sampling Distributions123 Questions
Exam 8: Interval Estimation111 Questions
Exam 9: Hypothesis Tests117 Questions
Exam 10: Comparisons Involving Means, Experimental Design, and Analysis of Variance184 Questions
Exam 11: Comparisons Involving Proportions and a Test of Independence117 Questions
Exam 12: Simple Linear Regression107 Questions
Exam 13: Multiple Regression111 Questions
Exam 14: Statistical Methods for Quality Control72 Questions
Exam 15: Time Series Analysis and Forecastng75 Questions
Select questions type
Exhibit 2-1
The numbers of hours worked (per week) by 400 statistics students are shown below.
 -Refer to Exhibit 2-1. The cumulative percent frequency for the class of 30 39 is
(Multiple Choice)
5.0/5  (40)
(40)
Excel's Chart Tools does not have a chart type for constructing a
(Multiple Choice)
4.9/5 (36)
What type of relationship is depicted in the following scatter diagram? 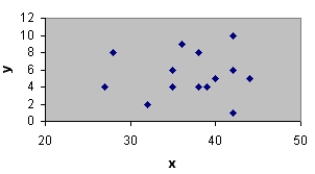
(Short Answer)
4.7/5 (29)
Exhibit 2-4
A survey of 400 college seniors resulted in the following crosstabulation regarding their undergraduate major and whether or not they plan to go to graduate school.
 -Refer to Exhibit 2-4. What percentage of the students does not plan to go to graduate school?
(Multiple Choice)
4.8/5 (39)
Which of the following is least useful in studying the relationship between two variables?
(Multiple Choice)
4.8/5 (35)
The sum of the relative frequencies in any relative frequency distribution always equals
(Multiple Choice)
4.9/5 (47)
The proper way to construct a stem-and-leaf display for the data set {62, 67, 68, 73, 73, 79, 91, 94, 95, 97} is to
(Multiple Choice)
4.8/5 (44)
The sum of the relative frequencies for all classes will always equal
(Multiple Choice)
4.9/5 (39)
When the conclusions based upon the aggregated crosstabulation can be completely reversed if we look at the unaggregated data, the occurrence is known as
(Multiple Choice)
4.8/5 (30)
For the following observations, plot a scatter diagram and indicate what kind of relationship (if any) exists between the amount of sugar in one serving of cereal (grams) and the amount of fiber in one serving of cereal (grams).

(Essay)
4.9/5 (33)
Below you are given the examination scores of 20 students.
 a.Construct a frequency distribution for this data. Let the first class be 50 - 59 and draw a histogram.
b.Construct a cumulative frequency distribution.
c.Construct a relative frequency distribution.
d.Construct a cumulative relative frequency distribution.
a.Construct a frequency distribution for this data. Let the first class be 50 - 59 and draw a histogram.
b.Construct a cumulative frequency distribution.
c.Construct a relative frequency distribution.
d.Construct a cumulative relative frequency distribution.
(Essay)
4.9/5 (39)
Thirty students in the School of Business were asked what their majors were. The following represents their responses (M Management; A Accounting; E Economics; O Others).
 a.Construct a frequency distribution and a bar chart.
b.Construct a relative frequency distribution and a pie chart.
a.Construct a frequency distribution and a bar chart.
b.Construct a relative frequency distribution and a pie chart.
(Essay)
4.8/5 (37)
The sum of the percent frequencies for all classes will always equal
(Multiple Choice)
4.7/5 (41)
To construct a pie chart using Excel's Chart Tools, choose __________ as the chart type.
(Multiple Choice)
4.8/5 (38)
Which of the following graphical methods is most appropriate for categorical data?
(Multiple Choice)
4.9/5 (35)
Filters
- Essay(0)
- Multiple Choice(0)
- Short Answer(0)
- True False(0)
- Matching(0)