Exam 1: Getting Started
Exam 1: Getting Started347 Questions
Exam 2: The Usand Global Economies211 Questions
Exam 3: The Economic Problem282 Questions
Exam 4: Demand and Supply334 Questions
Exam 5: Elasticities of Demand and Supply342 Questions
Exam 6: Efficiency and Fairness of Markets361 Questions
Exam 7: Government Actions in Markets335 Questions
Exam 8: Global Markets in Action281 Questions
Exam 9: Externalities: Pollution, education, and Health Care297 Questions
Exam 10: Production and Cost274 Questions
Exam 11: Perfect Competition285 Questions
Exam 12: Monopoly384 Questions
Exam 13: Monopolistic Competition and Oligopoly313 Questions
Exam 14: Gdp: a Measure of Total Production and Income263 Questions
Exam 15: Jobs and Unemployment293 Questions
Exam 16: The Cpi and the Cost of Living273 Questions
Exam 17: Potential Gdp and Economic Growth330 Questions
Exam 18: Money and the Monetary System370 Questions
Exam 19: Aggregate Supply and Aggregate Demand313 Questions
Exam 20: Fiscal Policy and Monetary Policy222 Questions
Select questions type
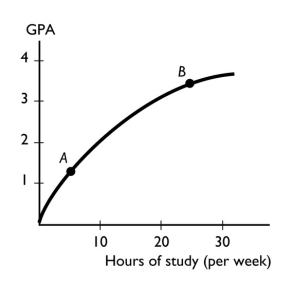 -The figure above shows the relationship between the time a student spends studying and the student's GPA that semester.This figure shows ________ relationship between the time spent studying and the GPA.
(Multiple Choice)
4.9/5  (37)
(37)
If the quantity of the variable on the y-axis increases by 3 when the quantity of the variable on the x-axis increases by 4,then the slope of the curve equals
(Multiple Choice)
5.0/5 (30)
As a shoe factory adds more workers,shoe production grows,reaches a maximum,and then shrinks.In a diagram that has the number of workers on the horizontal axis and the number of shoes on the vertical axis,the relationship between the number of workers and the number of shoes starts as ________ and then,after the maximum point,is ________.
(Multiple Choice)
4.8/5 (25)
In a graph,a straight line has a negative slope if the line
(Multiple Choice)
4.8/5 (34)
When a home builder decides to computerize all of its production schedule,it directly answers the ________ question.
(Multiple Choice)
4.7/5 (44)
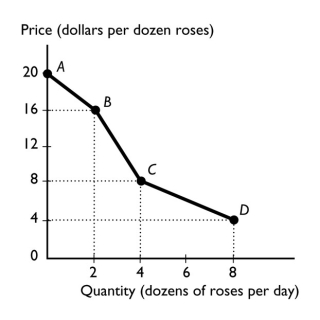 -The figure above shows the relationship between the price of a dozen roses and the quantity of roses a florist can sell.The slope between points C and D equals
(Multiple Choice)
4.8/5 (36)
Consider a diagram in which the variable measured on the y-axis remains constant while the variable measured on the x-axis increases.The graph of these two variables is
(Multiple Choice)
4.9/5 (35)
Instead of studying for an additional two hours for the economics final,Leann decides to watch a movie.Leann is making
(Multiple Choice)
4.7/5 (40)
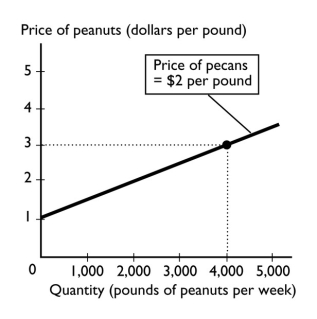 -The above figure shows how many pounds of peanuts farmers are willing to sell at different prices per pound of peanuts.If the price of a pound of peanuts is $1 and the price of a pound of pecans is $2,peanut farmers are willing to sell
(Multiple Choice)
4.9/5 (41)
Explain whether the statement "The government should increase tariffs on Japanese cars to protect the American car industry from competition," is a normative or positive statement.
(Essay)
4.8/5 (38)
On a graph showing the relationship between x and y,the ceteris paribus condition implies that
(Multiple Choice)
4.9/5 (41)
The important characteristic of normative statements is that they
(Multiple Choice)
4.8/5 (41)
Which economic question depends on the incomes that people earn and the prices they pay for goods and services?
(Multiple Choice)
4.9/5 (42)
When Ford decides to increase production of hybrid cars,it directly answers the ________ question.
(Multiple Choice)
4.8/5 (33)
Your friend is preparing for this exam and in your practice session makes the following statement: "Instead of attending microeconomics class for two hours,Kiki could have played tennis or watched a movie.Therefore,the opportunity cost of attending class is the tennis and the movie she had to give up." Is your friend's analysis correct or not? Explain your answer.
(Essay)
4.9/5 (35)
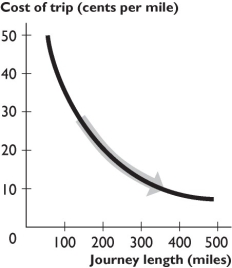 -The figure above shows the relationship between the journey length and the cost of trip per mile.The curve becomes flatter because as the journey length increases,
(Multiple Choice)
4.9/5 (43)
Filters
- Essay(0)
- Multiple Choice(0)
- Short Answer(0)
- True False(0)
- Matching(0)