Exam 1: Getting Started
Exam 1: Getting Started347 Questions
Exam 2: The Usand Global Economies211 Questions
Exam 3: The Economic Problem282 Questions
Exam 4: Demand and Supply334 Questions
Exam 5: Elasticities of Demand and Supply342 Questions
Exam 6: Efficiency and Fairness of Markets361 Questions
Exam 7: Government Actions in Markets335 Questions
Exam 8: Global Markets in Action281 Questions
Exam 9: Externalities: Pollution, education, and Health Care297 Questions
Exam 10: Production and Cost274 Questions
Exam 11: Perfect Competition285 Questions
Exam 12: Monopoly384 Questions
Exam 13: Monopolistic Competition and Oligopoly313 Questions
Exam 14: Gdp: a Measure of Total Production and Income263 Questions
Exam 15: Jobs and Unemployment293 Questions
Exam 16: The Cpi and the Cost of Living273 Questions
Exam 17: Potential Gdp and Economic Growth330 Questions
Exam 18: Money and the Monetary System370 Questions
Exam 19: Aggregate Supply and Aggregate Demand313 Questions
Exam 20: Fiscal Policy and Monetary Policy222 Questions
Select questions type
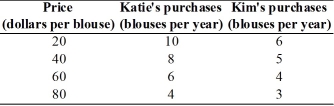 -The table above shows how many blouses Katie and Kim will purchase at different prices for a blouse.In the figure,label the axes and put the price on the y-axis and the quantity of blouses on the x-axis.Plot the data for Katie in the figure.Then,plot the data for Kim in the figure.
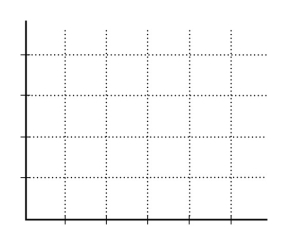
(Essay)
4.8/5  (40)
(40)
When unskilled teens earn less than college graduates,society answers the ________ question.
(Multiple Choice)
4.8/5 (33)
If the quantity of the variable on the y-axis increases by 10 when the quantity of the variable on the x-axis decreases by 2,then the slope of the curve equals
(Multiple Choice)
4.8/5 (32)
Which of the following statements is a normative statement?
(Multiple Choice)
4.7/5 (35)
Going skiing will cost Adam $80 a day.He also loses $40 per day in wages because he has to take time off from work.Adam still decides to go skiing.
(Multiple Choice)
4.9/5 (40)
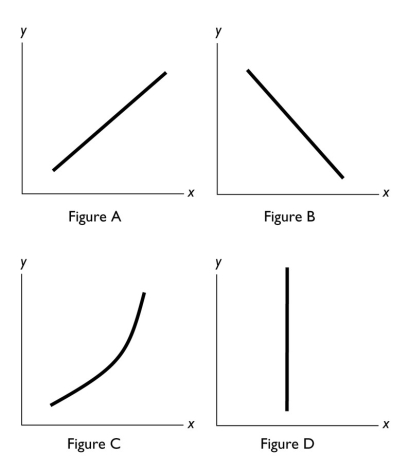 -In the diagram above,which figure(s)show(s)a direct relationship between the variables?
(Multiple Choice)
5.0/5 (36)
The statement that "increases in the tax on gasoline increase the price of gasoline" is an example of a
(Multiple Choice)
4.8/5 (35)
Nathan drinks three cups of coffee per day.The marginal benefit that he enjoys from drinking the third cup is
(Multiple Choice)
4.8/5 (37)
To graph a relationship that involves more than two variables,we use
(Multiple Choice)
5.0/5 (42)
Gregory is considering attending a concert with a ticket price of $40.He estimates that the cost of driving to the concert and parking there will add an additional $20.In order to attend the concert,Gregory will have to take time off from his part-time job.He estimates that he will lose 5 hours at work,at a wage of $8 per hour.Gregory's opportunity cost of attending the concert equals
(Multiple Choice)
4.7/5 (33)
Whenever one variable increases,another variable decreases.The two variables are
(Multiple Choice)
4.7/5 (34)
A choice made by comparing all relevant alternatives systematically and incrementally is
(Multiple Choice)
4.8/5 (35)
When analyzing graphically the relationship between more than two variables,which of the following must be used?
(Multiple Choice)
4.8/5 (34)
Which type of graph is most useful in determining if two variables are correlated?
(Multiple Choice)
4.8/5 (26)
Suppose you decide to attend summer school and that this is considered a rational choice.When making this choice,
(Multiple Choice)
4.9/5 (38)
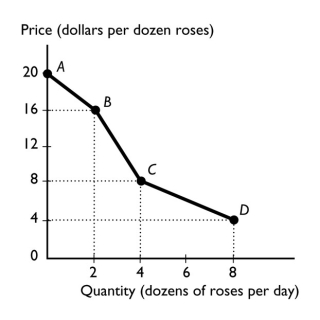 -The figure above shows the relationship between the price of a dozen roses and the quantity of roses a florist can sell.The relationship between the price and the quantity the florist can sell is
(Multiple Choice)
4.9/5 (35)
Filters
- Essay(0)
- Multiple Choice(0)
- Short Answer(0)
- True False(0)
- Matching(0)