Exam 1: Getting Started
Exam 1: Getting Started347 Questions
Exam 2: The Usand Global Economies211 Questions
Exam 3: The Economic Problem282 Questions
Exam 4: Demand and Supply334 Questions
Exam 5: Elasticities of Demand and Supply342 Questions
Exam 6: Efficiency and Fairness of Markets361 Questions
Exam 7: Government Actions in Markets335 Questions
Exam 8: Global Markets in Action281 Questions
Exam 9: Externalities: Pollution, education, and Health Care297 Questions
Exam 10: Production and Cost274 Questions
Exam 11: Perfect Competition285 Questions
Exam 12: Monopoly384 Questions
Exam 13: Monopolistic Competition and Oligopoly313 Questions
Exam 14: Gdp: a Measure of Total Production and Income263 Questions
Exam 15: Jobs and Unemployment293 Questions
Exam 16: The Cpi and the Cost of Living273 Questions
Exam 17: Potential Gdp and Economic Growth330 Questions
Exam 18: Money and the Monetary System370 Questions
Exam 19: Aggregate Supply and Aggregate Demand313 Questions
Exam 20: Fiscal Policy and Monetary Policy222 Questions
Select questions type
You have data for the amount of rainfall in 50 cities for the month of June.The type of graph to best display these data would be a
(Multiple Choice)
4.9/5  (42)
(42)
If a small change in the x variable results in a large change in the y variable,the curve will be
(Multiple Choice)
4.8/5 (42)
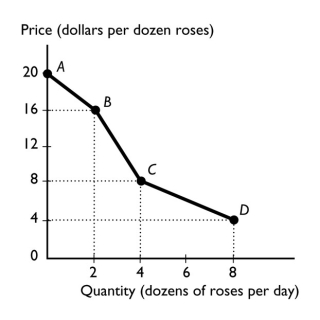 -The figure above shows the relationship between the price of a dozen roses and the quantity of roses a florist can sell.The slope between points A and B is
(Multiple Choice)
4.7/5 (44)
Must a rational choice always work out well? In other words,is it possible for someone to regret a rational decision?
(Essay)
4.8/5 (37)
A statement that argues that "if taxes on gasoline increase,gasoline consumption will decrease" is an example of what kind of statement?
(Multiple Choice)
4.8/5 (44)
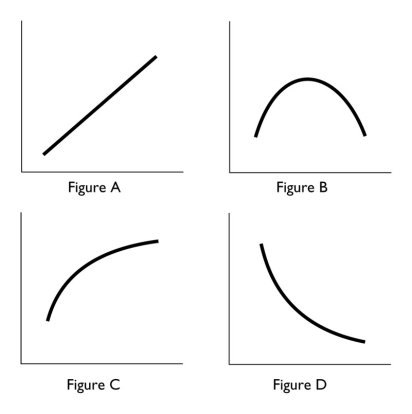 -In the above,which figure(s)has (have)at least one point at which the slope equals zero?
(Multiple Choice)
4.8/5 (35)
Which of the following is a microeconomic topic?
I.K-Mart's decision to close stores that are not making a profit
Ii.Home Depot's choice to hire more full-time employees because its sales increased
Iii.Delta Airlines changes its fares.
(Multiple Choice)
4.9/5 (37)
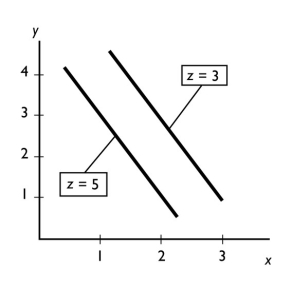 -In the figure above,ceteris paribus,an increase in x is associated with
(Multiple Choice)
4.7/5 (35)
If Jessie studies economics for two hours instead of going to the movies with her friends,then
(Multiple Choice)
4.8/5 (33)
The ________ of something is the gain or pleasure that it brings.
(Multiple Choice)
4.9/5 (40)
-In the above,which figure(s)show(s)a relationship between the variables that is always negative?
(Multiple Choice)
4.8/5 (35)
When Ferrari decides to produce 1,200 360 Modenas each year,Ferrari is answering the ________ question.
(Multiple Choice)
4.9/5 (35)
The opportunity cost of a decision is measured in terms of
(Multiple Choice)
4.9/5 (36)
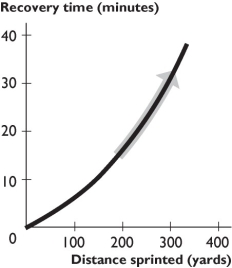 -The figure above shows the relationship between distance sprinted and recovery time.The curve becomes steeper because as the distance sprinted increases,
(Multiple Choice)
4.8/5 (39)
-In the above,which figure(s)show(s)relationship between the variables that is always positive?
(Multiple Choice)
4.8/5 (44)
Filters
- Essay(0)
- Multiple Choice(0)
- Short Answer(0)
- True False(0)
- Matching(0)