Exam 1: Getting Started
Exam 1: Getting Started347 Questions
Exam 2: The Usand Global Economies211 Questions
Exam 3: The Economic Problem282 Questions
Exam 4: Demand and Supply334 Questions
Exam 5: Elasticities of Demand and Supply342 Questions
Exam 6: Efficiency and Fairness of Markets361 Questions
Exam 7: Government Actions in Markets335 Questions
Exam 8: Global Markets in Action281 Questions
Exam 9: Externalities: Pollution, education, and Health Care297 Questions
Exam 10: Production and Cost274 Questions
Exam 11: Perfect Competition285 Questions
Exam 12: Monopoly384 Questions
Exam 13: Monopolistic Competition and Oligopoly313 Questions
Exam 14: Gdp: a Measure of Total Production and Income263 Questions
Exam 15: Jobs and Unemployment293 Questions
Exam 16: The Cpi and the Cost of Living273 Questions
Exam 17: Potential Gdp and Economic Growth330 Questions
Exam 18: Money and the Monetary System370 Questions
Exam 19: Aggregate Supply and Aggregate Demand313 Questions
Exam 20: Fiscal Policy and Monetary Policy222 Questions
Select questions type
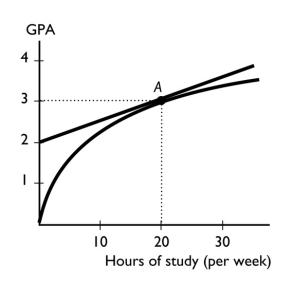 -The figure above shows the relationship between the time a student spends studying and the student's GPA that semester.The slope of the relationship at point A equals
(Multiple Choice)
4.8/5  (48)
(48)
If the marginal benefit of getting a college degree rises,rational people will
(Multiple Choice)
4.7/5 (36)
Which of the following scenarios describes an action that is not rational from an economic point of view?
(Multiple Choice)
4.9/5 (34)
Whenever people's incomes increase,they buy more guitars.Hence a scatter diagram shows that the relationship between income and guitars purchased is
(Multiple Choice)
4.8/5 (35)
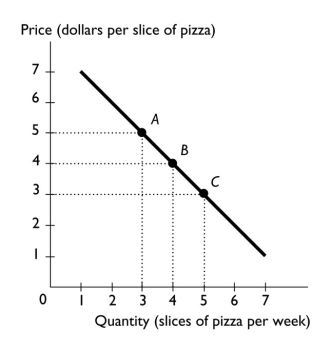 -The above figure shows the relationship between the price of a slice of pizza and how many slices of pizza Ricardo buys in a week.Between points A and B,the slope of the line is ________ the slope of the line between points B and C.
(Multiple Choice)
4.9/5 (35)
-The above figure shows the relationship between the price of a slice of pizza and how many slices of pizza Ricardo buys in a week.Between points A and B,the slope of the line equals
(Multiple Choice)
4.9/5 (29)
A graph that shows how the amount of advertising expenditure differs among various industries can be shown
(Multiple Choice)
4.9/5 (36)
Pumpkins are grown in New Mexico with the aid of fertilizer.Hence,fertilizer is a partial answer to which of the three economic questions?
(Essay)
4.8/5 (36)
Your economics professor offers 10 points extra credit if you attend a review session before your next exam.This extra credit is an example of
(Multiple Choice)
4.8/5 (35)
What are the two different types of relationships that variables can have? Explain each.What do these relationships look like when they are graphed?
(Essay)
4.8/5 (41)
Ali decides to attend the one-hour review session for microeconomics instead of working at his job.His job pays him $10 per hour.Ali's opportunity cost of attending the review session is
(Multiple Choice)
4.8/5 (35)
As a person increases his or her caloric intake,the person's weight increases,ceteris paribus.The relationship between the person's caloric intake and the person's weight is an example of
(Multiple Choice)
4.8/5 (33)
 -A graph of the relationship between two variables is a line that slopes down to the right.These two variables are ________ related.
(Multiple Choice)
4.9/5 (41)
John decides to leave college early and play professional sports.Which of the following economic principles does John use?
I.personal economic policies
Ii.marginal cost versus marginal benefit analysis
Iii.normative versus positive economics
(Multiple Choice)
4.8/5 (36)
Filters
- Essay(0)
- Multiple Choice(0)
- Short Answer(0)
- True False(0)
- Matching(0)