Exam 1: Getting Started
Exam 1: Getting Started347 Questions
Exam 2: The Usand Global Economies211 Questions
Exam 3: The Economic Problem282 Questions
Exam 4: Demand and Supply334 Questions
Exam 5: Elasticities of Demand and Supply342 Questions
Exam 6: Efficiency and Fairness of Markets361 Questions
Exam 7: Government Actions in Markets335 Questions
Exam 8: Global Markets in Action281 Questions
Exam 9: Externalities: Pollution, education, and Health Care297 Questions
Exam 10: Production and Cost274 Questions
Exam 11: Perfect Competition285 Questions
Exam 12: Monopoly384 Questions
Exam 13: Monopolistic Competition and Oligopoly313 Questions
Exam 14: Gdp: a Measure of Total Production and Income263 Questions
Exam 15: Jobs and Unemployment293 Questions
Exam 16: The Cpi and the Cost of Living273 Questions
Exam 17: Potential Gdp and Economic Growth330 Questions
Exam 18: Money and the Monetary System370 Questions
Exam 19: Aggregate Supply and Aggregate Demand313 Questions
Exam 20: Fiscal Policy and Monetary Policy222 Questions
Select questions type
Which of the following statements is a positive statement?
(Multiple Choice)
4.8/5  (43)
(43)
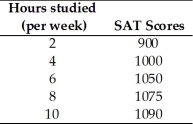 -Jamie is preparing to take his SAT tests.The table above shows how Jamie's score depends on the number of hours a week Jamie studies
a.Plot the relationship in the figure,putting the hours studied on the horizontal axis.
-Jamie is preparing to take his SAT tests.The table above shows how Jamie's score depends on the number of hours a week Jamie studies
a.Plot the relationship in the figure,putting the hours studied on the horizontal axis.  b.Is the relationship you plotted positive or negative?
c.What happens to the slope of the relationship as hours studied increase?
d.Suppose Jamie can enroll in an SAT prep course and,by so doing,for every possible number of hours he studies,his score will be 100 points higher.Plot the new relationship between the number of hours studied and Jamie's SAT score in the figure.
e.How many variables are involved in the figure you just completed?
b.Is the relationship you plotted positive or negative?
c.What happens to the slope of the relationship as hours studied increase?
d.Suppose Jamie can enroll in an SAT prep course and,by so doing,for every possible number of hours he studies,his score will be 100 points higher.Plot the new relationship between the number of hours studied and Jamie's SAT score in the figure.
e.How many variables are involved in the figure you just completed?
(Essay)
4.8/5 (31)
"It is impossible to represent a three variable relationship in a two-dimensional graph." Is this statement true or false? Explain your answer.
(Essay)
5.0/5 (40)
A graph shows the average SAT scores for males and females in 2012.The kind of graph used to show these data would be a
(Multiple Choice)
5.0/5 (50)
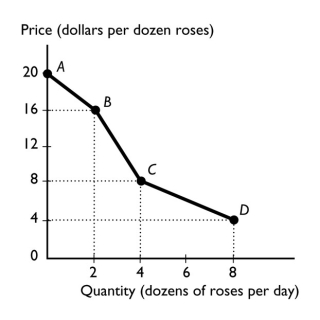 -The figure above shows the relationship between the price of a dozen roses and the quantity of roses a florist can sell.The slope between points B and C equals
(Multiple Choice)
4.9/5 (33)
Which of the following is true regarding this statement? "The president's decision to spend more money on national defense is smart."
(Multiple Choice)
4.8/5 (32)
When Fresh Express Salads decides to mechanically pick all of its lettuce,it directly answers the ________ question.
(Multiple Choice)
5.0/5 (31)
Choices that are best for the individuals that make them are choices in pursuit of
(Multiple Choice)
4.8/5 (32)
"Lower ticket prices would lead to more people attending ballgames." This statement is a
(Multiple Choice)
4.8/5 (43)
The characteristic from which all economic problems arise is
(Multiple Choice)
5.0/5 (38)
Different nations answer the what,how,and for whom questions differently.China,for instance,builds dams using many workers and only a little capital equipment.The United States builds dams using a few workers and a lot of capital equipment.Which economic question are these two nations answering and why do the answers differ?
(Essay)
4.7/5 (46)
When the power company decides to use manpower to bury its lines,it directly answers the ________ question.
(Multiple Choice)
4.9/5 (45)
Filters
- Essay(0)
- Multiple Choice(0)
- Short Answer(0)
- True False(0)
- Matching(0)