Exam 1: Getting Started
Exam 1: Getting Started347 Questions
Exam 2: The Usand Global Economies211 Questions
Exam 3: The Economic Problem282 Questions
Exam 4: Demand and Supply334 Questions
Exam 5: Elasticities of Demand and Supply342 Questions
Exam 6: Efficiency and Fairness of Markets361 Questions
Exam 7: Government Actions in Markets335 Questions
Exam 8: Global Markets in Action281 Questions
Exam 9: Externalities: Pollution, education, and Health Care297 Questions
Exam 10: Production and Cost274 Questions
Exam 11: Perfect Competition285 Questions
Exam 12: Monopoly384 Questions
Exam 13: Monopolistic Competition and Oligopoly313 Questions
Exam 14: Gdp: a Measure of Total Production and Income263 Questions
Exam 15: Jobs and Unemployment293 Questions
Exam 16: The Cpi and the Cost of Living273 Questions
Exam 17: Potential Gdp and Economic Growth330 Questions
Exam 18: Money and the Monetary System370 Questions
Exam 19: Aggregate Supply and Aggregate Demand313 Questions
Exam 20: Fiscal Policy and Monetary Policy222 Questions
Select questions type
List and explain the three fundamental economic questions that must be answered by all economic systems.
(Essay)
5.0/5  (34)
(34)
Why is the benefit of something measured by what you are willing to give up?
(Essay)
4.8/5 (34)
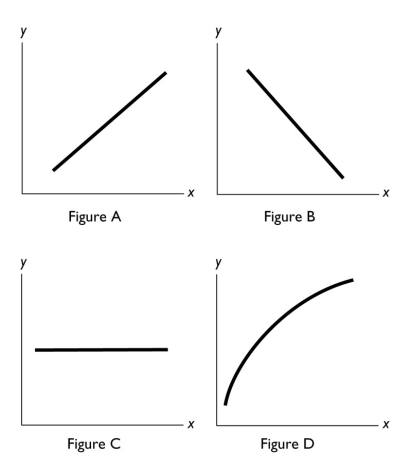 -In the above figure,which of the figures shows a relationship between x and y with a negative slope?
(Multiple Choice)
4.8/5 (36)
"Increasing income tax rates will solve the Social Security time bomb issue" is an example of
(Multiple Choice)
5.0/5 (34)
To show how a variable ________,we typically use a ________.
(Multiple Choice)
4.8/5 (37)
Kevin is re-finishing an antique grandfather clock that he purchased at a flea market for $300.He expects to be able to sell the clock for $450.At the last minute,Kevin discovers that he needs to repair the gears at a cost of $175 to make the clock worth $450 to potential buyers.It turns out that he could also sell the clock now,without completing the additional repairs,for $250.What should Kevin do?
(Multiple Choice)
4.7/5 (38)
Two economists can agree that raising the minimum wage creates unemployment yet one might argue that raising the minimum wage is a good policy and the other that it is a bad policy.Why can this difference exist? Be sure to use the terms positive and normative in your answer.
(Essay)
5.0/5 (30)
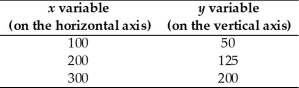 -The table above shows data on two variables.If these data were graphed,the slope of the line would be
(Multiple Choice)
4.9/5 (35)
To graph a relationship involving more than two variables,we use which assumption?
(Multiple Choice)
4.7/5 (43)
The question "Should we produce LCD televisions or computer monitors?" is an example of a ________ question.
(Multiple Choice)
4.8/5 (36)
The marginal cost of an activity ________ as you do more of it.
(Multiple Choice)
4.8/5 (33)
A time-series graph displays the price of gold.The slope of the line is negative for periods when the
(Multiple Choice)
4.9/5 (42)
A professor changes the penalty for cheating on exams from getting a 0 on the exam to getting an F in the course.The professor has
(Multiple Choice)
4.7/5 (46)
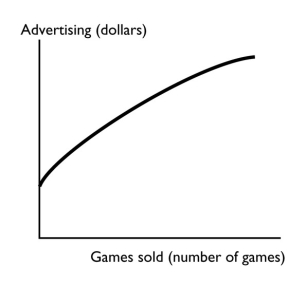 -The figure above shows how the sales of the video game "Tomb Raider-Lara Retires" change when the advertising spent on the game changes.Is the relationship between advertising and the number of games sold positive,negative,or neither? Explain your answer.
(Essay)
4.8/5 (44)
The cost of a one-unit increase in an activity is called the
(Multiple Choice)
4.9/5 (34)
A graph that shows the value of an economic variable for different groups in a population at a given time is called a
(Multiple Choice)
4.8/5 (44)
Filters
- Essay(0)
- Multiple Choice(0)
- Short Answer(0)
- True False(0)
- Matching(0)