Exam 14: The Labor Market in the Macroeconomy
Exam 1: The Scope and Method of Economics65 Questions
Exam 2: The Economic Problem: Scarcity and Choice107 Questions
Exam 3: Demand, Supply, and Market Equilibrium86 Questions
Exam 4: Demand and Supply Applications37 Questions
Exam 5: Introduction to Macroeconomics64 Questions
Exam 6: Measuring National Output and National Income84 Questions
Exam 7: Unemployment, Inflation, and Long-Run Growth81 Questions
Exam 8: Aggregate Expenditure and Equilibrium Output58 Questions
Exam 9: The Government and Fiscal Policy71 Questions
Exam 10: The Money Supply and the Federal Reserve System96 Questions
Exam 11: Money Demand and the Equilibrium Interest Rate96 Questions
Exam 12: The Determination of Aggregate Output, the Price Level, and the Interest Rate100 Questions
Exam 13: Policy Effects and Costs Shocks in the Asad Model89 Questions
Exam 14: The Labor Market in the Macroeconomy111 Questions
Exam 15: Financial Crises, Stabilization, and Deficits102 Questions
Exam 16: Household and Firm Behavior in the Macroeconomy: a Further Look92 Questions
Exam 17: Long-Run Growth59 Questions
Exam 18: Alternative Views in Macroeconomics88 Questions
Exam 19: International Trade, Comparative Advantage, and Protectionism63 Questions
Exam 20: Open-Economy Macroeconomics: the Balance of Payments and Exchange Rates105 Questions
Exam 21: Economic Growth in Developing and Transitional Economies48 Questions
Select questions type
Graphically illustrate an increase in the labor supply curve and explain its impact on the equilibrium wage rate and quantities. On a separate graph, illustrate an increase in the labor demand curve and explain its impact on the equilibrium wage rate and quantities.
Free
(Essay)
4.8/5  (35)
(35)
Correct Answer: Verified
In the following figure, the supply of labor has increased as illustrated by the rightward shift in the supply curve from S0 to S1 . The increase in labor supply lowers the equilibrium wage rate from W* to W1 which results in greater quantities supplied and demanded to L1 . 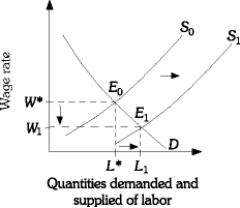
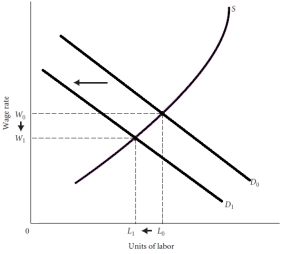
In the following figure, the demand for labor has increased as illustrated by the rightward shift in the demand curve from D0 to D1 . This results in an increase in the equilibrium wage rate to W1 and additional quantities demanded and supplied to L1 .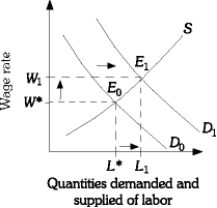
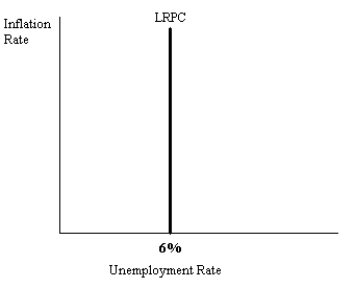
Assume that the frictional unemployment rate is 2% and the structural unemployment rate is 4%. Draw the long run Phillips curve that is consistent with this information.
Free
(Essay)
4.8/5 (38)
Correct Answer:Verified
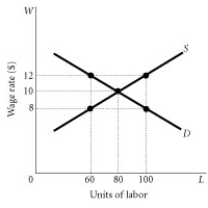 -Using the graph above, what will happen in the labor market if a minimum wage of $8 is imposed?
(Essay)
4.9/5 (31)
Explain how a decline in the demand for labor does not necessarily mean that unemployment will rise.
(Essay)
4.7/5 (25)
Explain the sequence of events that will unfold when there is an increase in aggregate demand while the economy is operating in the upward-sloping section of the aggregate supply curve. Make sure to include in your assessment the impact on the price level, inventories, output and employment.
(Essay)
4.8/5 (34)
What might be the potential benefit that firms are likely to receive if productivity increases as wages increase and firms pay a wage that is above the market clearing wage? Why is this benefit so important?
(Essay)
4.9/5 (31)
Assume that the percentage of the labor force covered by labor contracts that set wages for a predetermined period of time decreases. How will this impact the effectiveness of fiscal and monetary policy and why?
(Essay)
4.8/5 (28)
If the AD curve shifts from year to year, but the AS curve does not, draw the likely Phillips curve that will result.
(Essay)
4.9/5 (41)
Use a graph to demonstrate how the Classical view of the labor market will respond if there is a decrease in the demand for labor.
(Essay)
4.8/5 (32)
What sequence of events results from a decrease in aggregate demand? Explain the impact on the price level, inventories, output and employment.
(Essay)
4.7/5 (35)
Explain how expectations can be self-fulfilling in contributing to inflation.
(Essay)
4.8/5 (41)
If aggregate supply decreases and aggregate demand remains unchanged, what can be said about the relationship between the price level and the level of aggregate output?
(Essay)
4.8/5 (36)
Explain how social or implicit contracts might result in sticky wages.
(Essay)
4.8/5 (46)
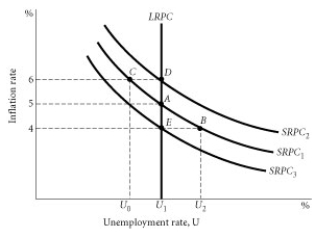 -Use the above graph to answer the following question. Suppose the economy is at Point A, what will be the effect in the short run of an increase in money supply? Where will this move the economy?
(Essay)
4.8/5 (31)
According the Classical view what are the only types of unemployment that exist in any economy?
(Essay)
4.8/5 (29)
Explain how the minimum wage laws account for a percentage of unemployment.
(Essay)
4.9/5 (36)
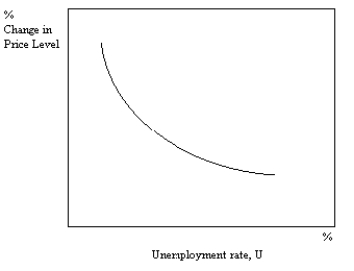
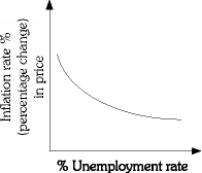
Define the Phillips Curve. Graphically illustrate the relationship between the inflation rate and the unemployment rate.
(Essay)
4.8/5 (33)
Explain how the minimum wage laws may cause unemployment. What age group is most adversely affected by the minimum wage law?
(Essay)
4.8/5 (30)
Briefly discuss the classical view of the labor market. Specifically, to what extent can unemployment occur based on the classical view? Explain.
(Essay)
4.8/5 (27)
Filters
- Essay(0)
- Multiple Choice(0)
- Short Answer(0)
- True False(0)
- Matching(0)