Exam 3: Numerical Descriptive Measures
Exam 1: Statistics and Data100 Questions
Exam 2: Tabular and Graphical Methods123 Questions
Exam 3: Numerical Descriptive Measures151 Questions
Exam 4: Basic Probability Concepts116 Questions
Exam 5: Discrete Probability Distributions139 Questions
Exam 6: Continuous Probability Distributions128 Questions
Exam 7: Sampling and Sampling Distributions124 Questions
Exam 8: Interval Estimation123 Questions
Exam 9: Hypothesis Testing135 Questions
Exam 10: Statistical Inference Concerning Two Populations124 Questions
Exam 11: Statistical Inference Concerning Variance111 Questions
Exam 12: Chi-Square Tests120 Questions
Exam 13: Analysis of Variance58 Questions
Exam 14: Regression Analysis140 Questions
Exam 15: Inference With Regression Models124 Questions
Exam 16: Regression Models for Nonlinear Relationships115 Questions
Exam 17: Regression Models With Dummy Variables114 Questions
Exam 18: Time Series and Forecasting124 Questions
Exam 19: Returns, Index Numbers and Inflation120 Questions
Exam 20: Nonparametric Tests108 Questions
Select questions type
The covariance between the returns on two assets is negative.This occurs when ______________________________________________________________________________________.
(Multiple Choice)
4.9/5  (45)
(45)
Consider a population with data values of 12 8 28 22 12 30 14.
The mode is ____.
(Multiple Choice)
4.9/5 (33)
Suppose the wait to passthrough immigration at JFK Airport in New York is thought to be bell-shaped and symmetrical with a mean of 22 minutes.It is known that 68% of travelers will spend between 16 and 28 minutes waiting to pass through immigration.The standard deviation for the wait time through immigration is _________.
(Multiple Choice)
4.9/5 (31)
Consider a population with data values of 12 8 28 22 12 30 14.
The population variance is the closest to ______.
(Multiple Choice)
4.9/5 (34)
The following data represent the wait time,in minutes,for customers calling Dell technical support. 14 21 37 24 19 12 16 69 13
The interquartile range is _________.
(Multiple Choice)
4.9/5 (28)
A luxury apartment complex in South Beach Miami is for sale.The owner has received the following offers in millions of dollars.
64 72 66 58 78 82
a.What is the mean offer price?What is the median offer price? Is the mean a good measure of central location?
b.What is the sample standard deviation of the offers?
c.What is equivalent to a 75th percentile offer?
(Essay)
4.7/5 (37)
The following is a list of GPA ranges and frequencies from a high school.Use 1.5 as the midpoint of the 2.0 or less category. 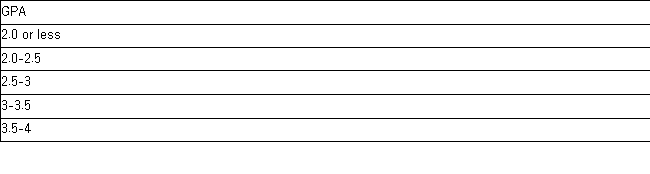 a.What is the mean GPA?
b.What is the sample standard deviation of the GPA
c.Assuming the distribution is bell shaped what percentage of the students would have GPA's between 1.5 and 3.9? Does this make sense given what you know about GPA's?
a.What is the mean GPA?
b.What is the sample standard deviation of the GPA
c.Assuming the distribution is bell shaped what percentage of the students would have GPA's between 1.5 and 3.9? Does this make sense given what you know about GPA's?
(Essay)
4.8/5 (30)
Total revenue for Apple Computers(in millions)was $42,905 in 2009,$65,225 in 2010,and $108,249 in 2011.The average growth rate of revenue during these three years is the closest to _______.
(Multiple Choice)
4.9/5 (33)
A college professor collected data on the number of hours spent by his 100 students over the weekend to prepare for Monday's Business Statistics exam.He processed the data by Excel and the following incomplete output is available. 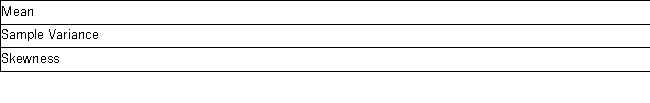 The coefficient of variation in the data is ______.
(Multiple Choice)
4.8/5 (39)
When applicable,the empirical rule provides the approximate percentage of observations that fall within
(Multiple Choice)
4.8/5 (39)
Which of the following statements is most accurate when defining percentiles?
(Multiple Choice)
4.8/5 (36)
Amounts spent by a sample of 200 customers at a retail store are summarized in the following relative frequency distribution. 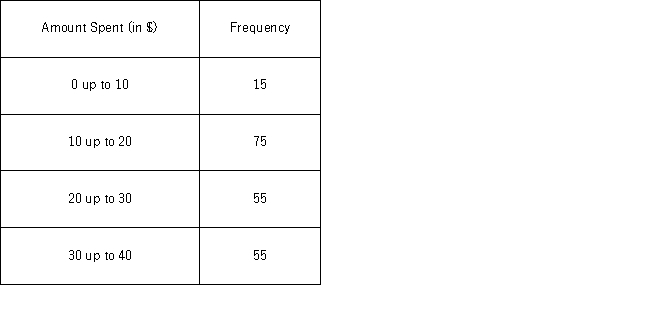 The median amount will fall in the following class interval ____________.
(Multiple Choice)
4.8/5 (39)
The following table summarizes selected statistics for two portfolios for a 10-year period ending in 2006.Assume that the risk-free rate is 4% over this period. 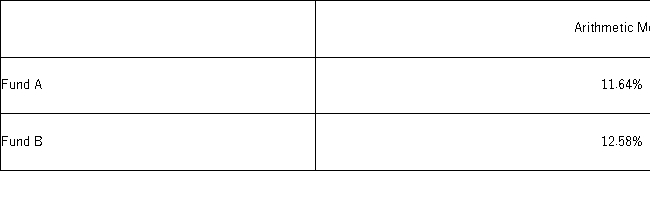 As measured by the Sharpe ratio,the fund with the superior risk-adjusted performance during this period is _________________________________________________________.
(Multiple Choice)
4.8/5 (42)
The following data represent the wait time,in minutes,for customers calling Dell technical support. 14 21 37 24 19 12 16 69 13
The upper limit for determining outliers for a box-and-whicker plot is _________.
(Multiple Choice)
4.9/5 (48)
An investor bought common stock of Blackstone Company on several occasions at the following prices.The following frequency distribution represents the number of hours studied per week by a sample of 50 students. 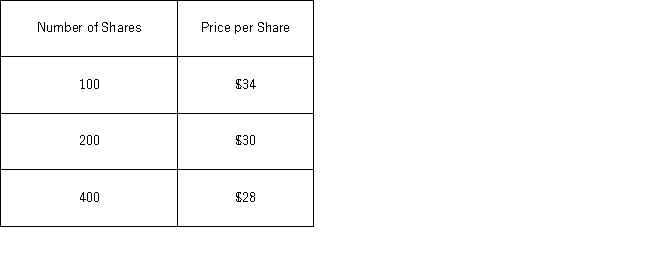 The average price per share at which the investor bought these shares of common stock was the closest to _____.
(Multiple Choice)
4.9/5 (42)
The following gives summary measures for Google and Apple for 2005-2010. 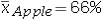
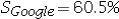 a.Which fund had the higher arithmetic average return?
b.Which fund was riskier over this time period?
c.Given a risk-free rate of 1%,which fund has the higher Sharpe ratio?What does this imply?
a.Which fund had the higher arithmetic average return?
b.Which fund was riskier over this time period?
c.Given a risk-free rate of 1%,which fund has the higher Sharpe ratio?What does this imply?
(Essay)
4.8/5 (40)
Consider a population with data values of 12 8 28 22 12 30 14.
The population standard deviation is the closest to _____.
(Multiple Choice)
4.9/5 (34)
Filters
- Essay(0)
- Multiple Choice(0)
- Short Answer(0)
- True False(0)
- Matching(0)