Exam 3: Numerical Descriptive Measures
Exam 1: Statistics and Data100 Questions
Exam 2: Tabular and Graphical Methods123 Questions
Exam 3: Numerical Descriptive Measures151 Questions
Exam 4: Basic Probability Concepts116 Questions
Exam 5: Discrete Probability Distributions139 Questions
Exam 6: Continuous Probability Distributions128 Questions
Exam 7: Sampling and Sampling Distributions124 Questions
Exam 8: Interval Estimation123 Questions
Exam 9: Hypothesis Testing135 Questions
Exam 10: Statistical Inference Concerning Two Populations124 Questions
Exam 11: Statistical Inference Concerning Variance111 Questions
Exam 12: Chi-Square Tests120 Questions
Exam 13: Analysis of Variance58 Questions
Exam 14: Regression Analysis140 Questions
Exam 15: Inference With Regression Models124 Questions
Exam 16: Regression Models for Nonlinear Relationships115 Questions
Exam 17: Regression Models With Dummy Variables114 Questions
Exam 18: Time Series and Forecasting124 Questions
Exam 19: Returns, Index Numbers and Inflation120 Questions
Exam 20: Nonparametric Tests108 Questions
Select questions type
The following is data a veterinarian collected from some of her clients.It is a rough estimate of a dog's weight and how long the dog lived. 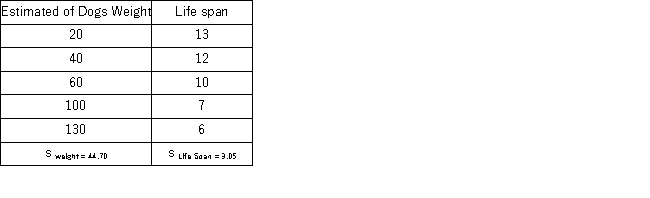
(Essay)
4.8/5  (35)
(35)
In an accounting class of 200 students,the mean and standard deviation of scores was 70 and 5,respectively.Use the empirical rule to determine the number of students who scored less than 65 or more than 75.
(Multiple Choice)
4.9/5 (40)
The following data represents the actual talk time,in hours,for the iPhone for 11 users. 25.1 19.1 21.6 9.5 20.3 18.0 24.6 25.2 21.9 29.7 28.5
What percentile is the talk time of 21.6 hours?
(Multiple Choice)
4.8/5 (36)
Amounts spent by a sample of 50 customers at a retail store are summarized in the following relative frequency distribution. 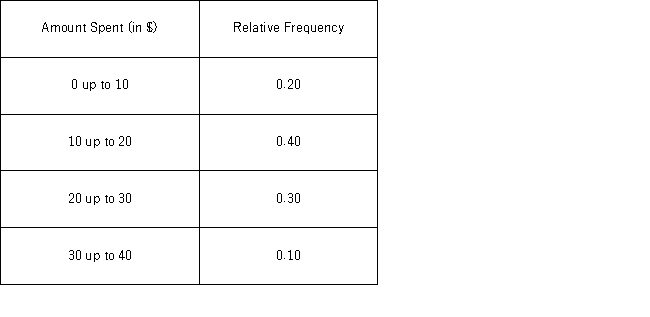 The median amount will fall in the following class interval _____________.
(Multiple Choice)
4.9/5 (32)
Professors at a local university earn an average salary of $80,000 with a standard deviation of $6,000.The salary distribution is approximately bell-shaped.What can be said about the percentage of salaries that are at least $74,000?
(Multiple Choice)
4.9/5 (31)
The mean starting salary of recent business graduates at a university is $52,000 with a standard deviation of $16,000.The distribution of starting salaries is unknown.
a.What proportion of business graduates has a starting salary between $20,000 and $84,000.
b.Suppose 600 business graduates from this university got hired.How many of them started with a salary between $20,000 and $84,000?
(Essay)
4.9/5 (43)
What is an advantage of the correlation coefficient over the covariance?
(Multiple Choice)
4.9/5 (32)
The annual returns (in percent)for a sample of stocks in the technology industry over the past year are as follows: 4.2 -9.4 2.8 -16.0 -6.6.
The sample standard deviation is the closest to _____.
(Multiple Choice)
4.7/5 (28)
The Sharpe ratio measures______________________________________.
(Multiple Choice)
4.8/5 (33)
When interpreting the covariance between variables x and y,which of the following statements is the most accurate?
(Multiple Choice)
5.0/5 (42)
Professors at a local university earn an average salary of $80,000 with a standard deviation of $6,000.The salary distribution is approximately bell-shaped.Because of budget limitations,it has been decided that only those whose salaries are approximately in the bottom 2.5% would get a raise.What is the maximum current salary that qualifies for the raise?
(Multiple Choice)
4.8/5 (27)
The terms central location or central tendency refer to the way quantitative data tend to cluster around some middle or central value.
(True/False)
4.8/5 (33)
The sample data below shows the number of hours spent by five students over the weekend to prepare for Monday's Business Statistics exam. 3 12 2 3 5.
The 75th percentile of the data is the closest to _________.
(Multiple Choice)
4.8/5 (30)
The data shows operating expenses (in Millions)for British Petroleum for the years 2008 through 2010.  a.Use the growth rates from 2008-2009 and 2009-2010 to calculate the average growth rate.
b.Calculate the average growth rate directly from sales.
a.Use the growth rates from 2008-2009 and 2009-2010 to calculate the average growth rate.
b.Calculate the average growth rate directly from sales.
(Essay)
4.8/5 (38)
The variance and standard deviation are the most widely used measures of central location.
(True/False)
4.9/5 (33)
Automobiles traveling on a road with a posted speed limit of 65 miles per hour are checked for speed by a state police radar system.The following is a frequency distribution of speeds.The following frequency distribution represents the number of hours studied per week by a sample of 50 students. 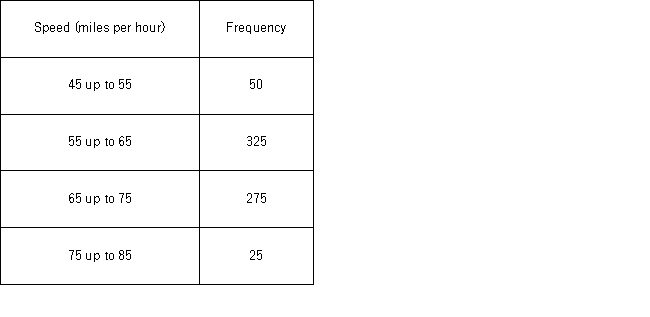 The mean speed of the automobiles traveling on this road is the closest to ____.
(Multiple Choice)
4.8/5 (38)
The coefficient of variation is best described as ___________________________________.
(Multiple Choice)
4.9/5 (38)
Consider a population with data values of 12 8 28 22 12 30 14.
The median is ____.
(Multiple Choice)
4.9/5 (45)
Filters
- Essay(0)
- Multiple Choice(0)
- Short Answer(0)
- True False(0)
- Matching(0)