Exam 3: Numerical Descriptive Measures
Exam 1: Statistics and Data100 Questions
Exam 2: Tabular and Graphical Methods123 Questions
Exam 3: Numerical Descriptive Measures151 Questions
Exam 4: Basic Probability Concepts116 Questions
Exam 5: Discrete Probability Distributions139 Questions
Exam 6: Continuous Probability Distributions128 Questions
Exam 7: Sampling and Sampling Distributions124 Questions
Exam 8: Interval Estimation123 Questions
Exam 9: Hypothesis Testing135 Questions
Exam 10: Statistical Inference Concerning Two Populations124 Questions
Exam 11: Statistical Inference Concerning Variance111 Questions
Exam 12: Chi-Square Tests120 Questions
Exam 13: Analysis of Variance58 Questions
Exam 14: Regression Analysis140 Questions
Exam 15: Inference With Regression Models124 Questions
Exam 16: Regression Models for Nonlinear Relationships115 Questions
Exam 17: Regression Models With Dummy Variables114 Questions
Exam 18: Time Series and Forecasting124 Questions
Exam 19: Returns, Index Numbers and Inflation120 Questions
Exam 20: Nonparametric Tests108 Questions
Select questions type
The director of graduate admissions is analyzing the relationship between scores in the GRE and student performance in graduate school,as measured by a student's GPA.The table below shows sample of 10 students. 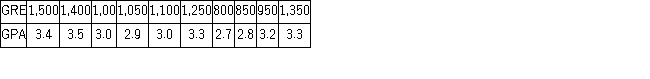 Which of the following statements is correct?
(Multiple Choice)
4.9/5  (41)
(41)
The sample data below shows the number of hours spent by five students over the weekend to prepare for Monday's Business Statistics exam. 3 12 2 3 5.
The interquartile range of the data is the closest to ________.
(Multiple Choice)
4.8/5 (35)
The following frequency distribution represents the number of hours studied per week by a sample of 50 students. 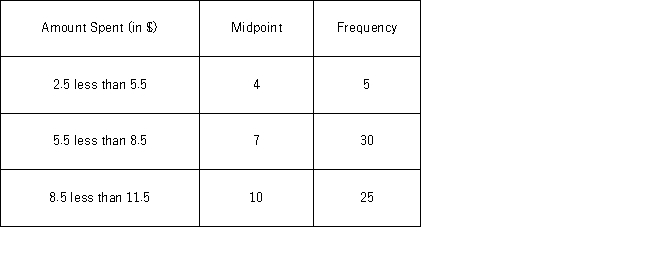 The mean number of hours studied is ____.
(Multiple Choice)
4.8/5 (48)
Which of the following capabilities does Analysis of Relative Location provide?
(Multiple Choice)
4.9/5 (33)
The z-score has no units even though the original values will normally be expressed in units such as dollars,years,pounds,or calories.
(True/False)
4.9/5 (37)
An analyst gathered the following information about the net profit margins of companies in two industries: 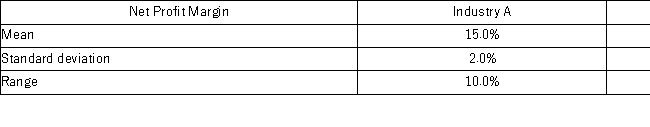 Compared with the other industry,the relative dispersion of net profit margins is smaller for Industry ___________________________________________.
(Multiple Choice)
4.8/5 (38)
What is the relationship between the variance and the standard deviation?
(Multiple Choice)
4.7/5 (37)
The following is return data for a Retail sector ETF and Energy Sector ETF for the years 2007 through 2011. 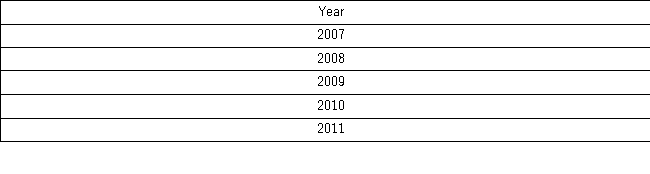 a.What is the arithmetic mean return for each ETF?
b.What is the geometric mean return for each ETF?
c.What is the sample standard deviation for each ETF? Which ETF was riskier over this time period?
d.Given a risk free rate of 5%.What is the Sharpe Ratio for each ETF?Which investment had a better return per unit of risk over this time period?
a.What is the arithmetic mean return for each ETF?
b.What is the geometric mean return for each ETF?
c.What is the sample standard deviation for each ETF? Which ETF was riskier over this time period?
d.Given a risk free rate of 5%.What is the Sharpe Ratio for each ETF?Which investment had a better return per unit of risk over this time period?
(Essay)
4.8/5 (38)
When working with grouped data,the class median is the value in the middle of the class and can be found by taking the average of the endpoints for each class.
(True/False)
4.9/5 (37)
A box plot is useful when comparing similar information gathered at different places or times.
(True/False)
4.8/5 (34)
Janice Anooshian asks eight of her friends about the number of hours they spend daily on Facebook.Their responses are:
2 1 1 8 2 1 1 2.
Calculate the mean,median,and mode numbers of hours her friends spent on Facebook.Does the mean accurately reflect the center of the data?
(Essay)
4.7/5 (36)
The price to earnings ratio,also called the P/E ratio of a stock,is a measure of the price of a share relative to the annual net income per share earned by the firm.Suppose the P/Es for a firm's common stock during the past four quarters are 10,12,15,and 11,respectively.The standard deviation of the P/E ratio over the four quarters is ______.
(Multiple Choice)
4.7/5 (44)
The following is a list of average wind speeds at a local surf spot in California over the last week.
8 17 19 6 3 9 12
a.What is the range in wind speed?
b.What is the Mean Absolute Deviation of the wind speed?
(Essay)
4.7/5 (44)
When using the empirical rule,which of the following assumptions is made?
(Multiple Choice)
4.9/5 (43)
The following represent the sizes of fleece jackets for kids sold at a local Old Navy Store:
6 7 4 8 1 0 4 5 4 4 6
Calculate the mean,median,and mode size of fleece jackets for kids.Which of these measures of the central location represents the age that the store would like to target for advertisement dollars.
(Essay)
4.8/5 (43)
The owner of a company has recently decided to raise the salary of one employee,who was already making the highest salary,by 20%.Which of the following is(are)expected to be affected by this raise?
(Multiple Choice)
4.9/5 (36)
Consider the following data: 1,2,4,5,10,12,18.The 30th percentile is the closest to ____.
(Multiple Choice)
4.7/5 (37)
Filters
- Essay(0)
- Multiple Choice(0)
- Short Answer(0)
- True False(0)
- Matching(0)