Exam 3: Numerical Descriptive Measures
Exam 1: Statistics and Data100 Questions
Exam 2: Tabular and Graphical Methods123 Questions
Exam 3: Numerical Descriptive Measures151 Questions
Exam 4: Basic Probability Concepts116 Questions
Exam 5: Discrete Probability Distributions139 Questions
Exam 6: Continuous Probability Distributions128 Questions
Exam 7: Sampling and Sampling Distributions124 Questions
Exam 8: Interval Estimation123 Questions
Exam 9: Hypothesis Testing135 Questions
Exam 10: Statistical Inference Concerning Two Populations124 Questions
Exam 11: Statistical Inference Concerning Variance111 Questions
Exam 12: Chi-Square Tests120 Questions
Exam 13: Analysis of Variance58 Questions
Exam 14: Regression Analysis140 Questions
Exam 15: Inference With Regression Models124 Questions
Exam 16: Regression Models for Nonlinear Relationships115 Questions
Exam 17: Regression Models With Dummy Variables114 Questions
Exam 18: Time Series and Forecasting124 Questions
Exam 19: Returns, Index Numbers and Inflation120 Questions
Exam 20: Nonparametric Tests108 Questions
Select questions type
The following data represent monthly returns (in percent): -7.24 1.64 3.48 -2.49 9.30
The geometric mean return is the closest to ________.
(Multiple Choice)
4.8/5  (36)
(36)
Mean-variance analysis suggests that investments with lower average returns are also associated with higher risks.
(True/False)
4.7/5 (32)
A bowler's scores for a sample of six games were 172 168 188 190 172 182 174.
The bowler's median score is _____.
(Multiple Choice)
4.7/5 (37)
John lives in Los Angeles and hates the traffic.He asked a sample of 6 of his coworkers who live all over Los Angles how many hours they spend commuting every year.These are their responses in hours per year.
20 240 260 300 310 570
a.Calculate and interpret the 30th,50th,and 70th percentiles.
b.Are there any outliers? Is the distribution symmetric? If not,comment on its skewness.
(Essay)
4.8/5 (31)
Automobiles traveling on a road with a posted speed limit of 65 miles per hour are checked for speed by a state police radar system.The following is a frequency distribution of speeds. 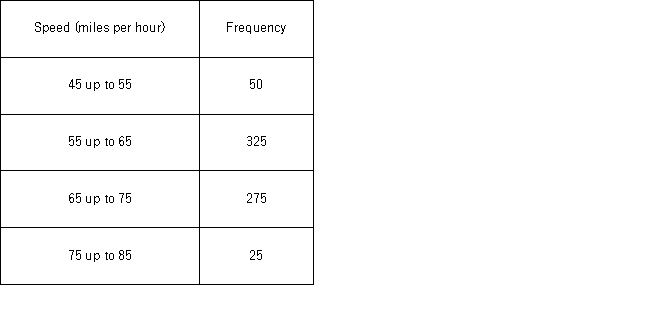 The standard deviation of this distribution is the closest to ____.
(Multiple Choice)
4.8/5 (37)
Amounts spent by a sample of 50 customers at a retail store are summarized in the following relative frequency distribution. 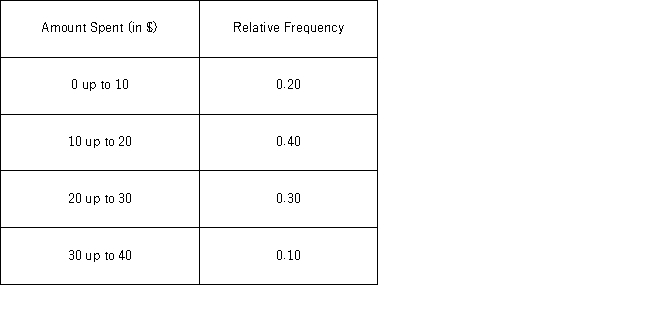 The mean amount spent by customers is the closest to ______.
(Multiple Choice)
4.7/5 (30)
In quality control settings,businesses prefer a larger standard deviation,which is an indication of more consistency in the process.
(True/False)
4.8/5 (36)
Amounts spent by a sample of 200 customers at a retail store are summarized in the following relative frequency distribution. 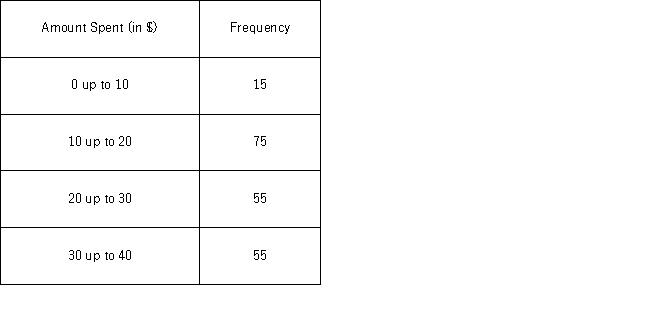 The mean amount spent by customers is the closest to _____.
(Multiple Choice)
4.9/5 (31)
The empirical rule can be used to estimate some proportions_________________.
(Multiple Choice)
4.8/5 (33)
The following table shows the annual returns (in percent)Chevron and Caterpillar for 2007-2010. 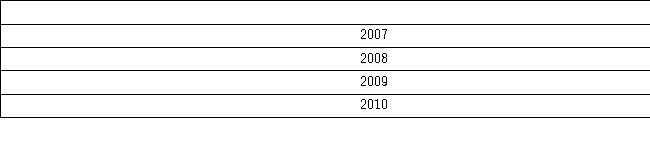 a.Which fund had the higher arithmetic average return?
b.Which fund was riskier over this time period?
c.Given a risk-free rate of 1%,which fund has the higher Sharpe ratio?What does this imply?
a.Which fund had the higher arithmetic average return?
b.Which fund was riskier over this time period?
c.Given a risk-free rate of 1%,which fund has the higher Sharpe ratio?What does this imply?
(Essay)
4.7/5 (47)
A portfolio's annual total returns (in percent)for a five-year period are: -7.14 1.62 2.50 -2.50 9.27.
The median and the standard deviation for this sample are the closest to ______________.
(Multiple Choice)
4.9/5 (37)
A bowler's scores for a sample of six games were 172 168 188 190 172 182 174.
The bowler's average score is _____.
(Multiple Choice)
4.9/5 (51)
There are five rows of students seated in a marketing class.The following table shows the number of students in each row and the average score of the most recent test for that row. 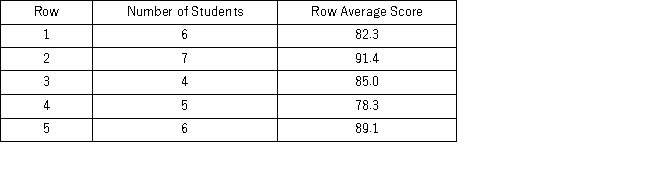 What is the average test score for this class?
(Multiple Choice)
4.9/5 (26)
The following frequency distribution represents the number of hours studied per week by a sample of 50 students. 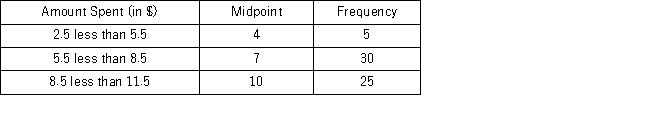 The standard deviation of the number of hours studied is ____.
(Multiple Choice)
4.7/5 (28)
A portfolio manager generates a 5% return in 2008,a 12% return in 2009,a negative 6% return in 2010,and a return of 2% (nonannualized)in the first quarter of 2011.The annualized return for the entire period is theclosest to _______.
(Multiple Choice)
4.8/5 (37)
The annual returns (in percent)for a sample of stocks in the technology industry over the past year are as follows: 4.2 -9.4 2.8 -16.0 -6.6.
The median return is the closest to _____.
(Multiple Choice)
4.8/5 (36)
Yearly returns (rounded to the nearest percent)for GLD a gold exchange traded fund and SLV a silver exchange traded fund are reported in the following table.  a.Calculate the covariance between GLD and SLV.
b.Calculate and interpret the correlation coefficient.
a.Calculate the covariance between GLD and SLV.
b.Calculate and interpret the correlation coefficient.
(Essay)
4.9/5 (35)
The Boom company has recently decided to raise the salaries of all employees by 10%.Which of the following is(are)expected to be affected by this raise?
(Multiple Choice)
4.9/5 (37)
The coefficient of variation is a unit-free measure of dispersion.
(True/False)
4.8/5 (39)
Filters
- Essay(0)
- Multiple Choice(0)
- Short Answer(0)
- True False(0)
- Matching(0)