Multiple Choice
Use the figure to answer the question.
-The bar graph below shows the number of students by major in the College of Arts and Sciences. 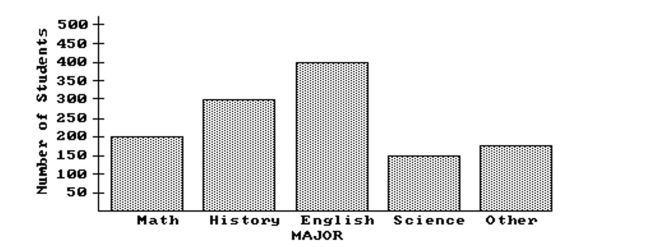 How many students are in the College of Arts and Sciences?
A) 1325
B) 1050
C) 1225
D) 1275
Correct Answer:

Verified
Correct Answer:
Verified
Q37: Use the figure to answer the question.<br>-The
Q38: Identify whether the given scatterplot shows a
Q39: Use the figure to answer the
Q40: Use the figure to answer the question.<br>-The
Q41: Construct the requested statistical display.<br>-The attendance
Q43: Construct the requested statistical display.<br>-Kevin asked
Q44: Use the circle graph to solve the
Q45: Use the statistical display to answer the
Q46: Use the figure to answer the
Q47: Construct the requested statistical display.<br>-The mileage