Essay
Use the figure to answer the question.
-The numbers of students in the College of Arts and Sciences, categorized by major, are listed
below. Make a bar graph for the data. 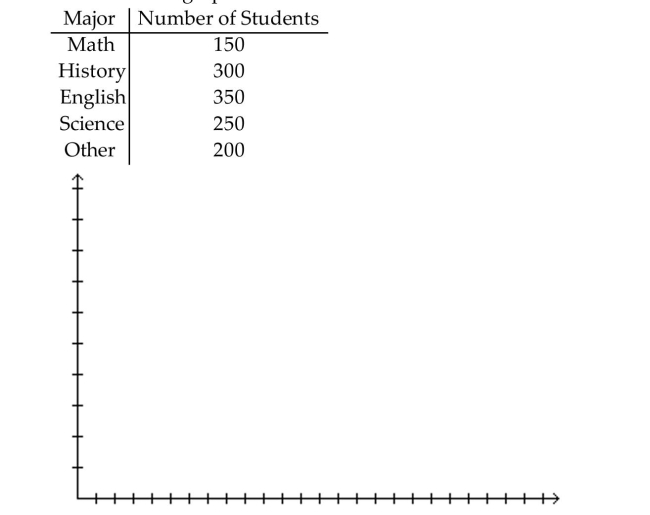
Correct Answer:

Verified
Correct Answer:
Verified
Q47: Construct the requested statistical display.<br>-The mileage
Q48: Construct the requested statistical display.<br>-The one-day temperatures
Q49: Use the figure to answer the question.<br>-The
Q50: Construct the requested statistical display.<br>-The numbers
Q51: Use the statistical display to answer the
Q53: Use the statistical display to answer the
Q54: Use the figure to answer the question.<br>-This
Q55: Construct the requested statistical display.<br>-The weights
Q56: Identify whether the given scatterplot shows a
Q57: Use the circle graph to solve the