Multiple Choice
Use the figure to answer the question.
-The sales figures for the Big "D" Company are shown below in a line graph. 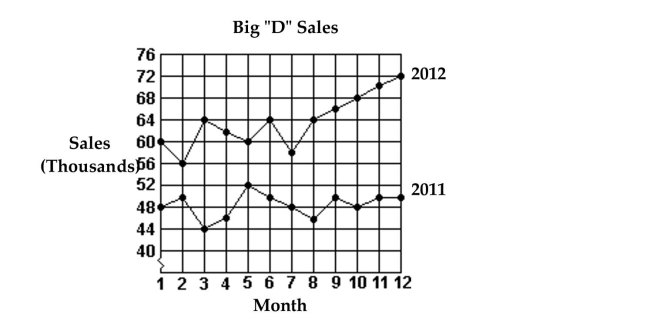 Which month in 2011 had the lowest sales?
A) Month 8
B) Month 2
C) Month 3
D) Month 6
Correct Answer:

Verified
Correct Answer:
Verified
Related Questions
Q44: Use the circle graph to solve the
Q45: Use the statistical display to answer the
Q46: Use the figure to answer the
Q47: Construct the requested statistical display.<br>-The mileage
Q48: Construct the requested statistical display.<br>-The one-day temperatures
Q50: Construct the requested statistical display.<br>-The numbers
Q51: Use the statistical display to answer the
Q52: Use the figure to answer the question.<br>-The
Q53: Use the statistical display to answer the
Q54: Use the figure to answer the question.<br>-This