Essay
Construct the requested statistical display.
-The one-day temperatures for 12 world cities along with their latitudes are shown in the table below. Make a scatterplot for the data. 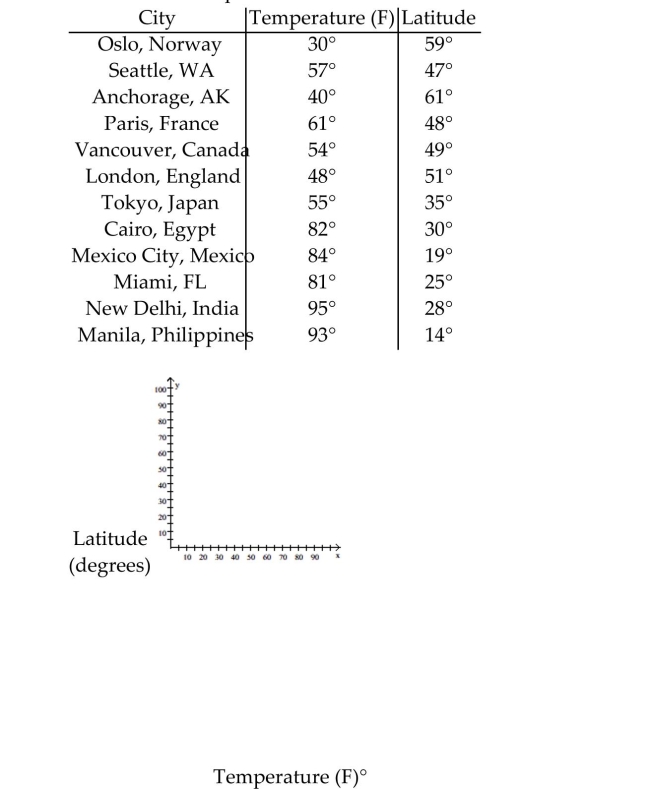
Correct Answer:

Verified
Correct Answer:
Verified
Related Questions
Q43: Construct the requested statistical display.<br>-Kevin asked
Q44: Use the circle graph to solve the
Q45: Use the statistical display to answer the
Q46: Use the figure to answer the
Q47: Construct the requested statistical display.<br>-The mileage
Q49: Use the figure to answer the question.<br>-The
Q50: Construct the requested statistical display.<br>-The numbers
Q51: Use the statistical display to answer the
Q52: Use the figure to answer the question.<br>-The
Q53: Use the statistical display to answer the