Multiple Choice
Use the figure to answer the question.
-This double-bar graph shows the number of male (M) and female (F) athletes at a university over a four-year period. 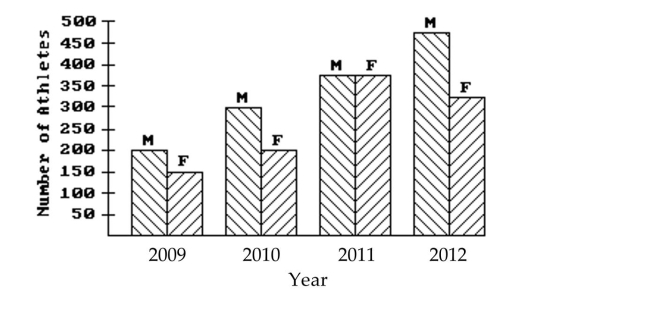 Which year had the greatest number of male athletes?
A) 2011
B) 2012
C) 2009
D) 2010
Correct Answer:

Verified
Correct Answer:
Verified
Q47: Construct the requested statistical display.<br>-The mileage
Q48: Construct the requested statistical display.<br>-The one-day temperatures
Q49: Use the figure to answer the question.<br>-The
Q50: Construct the requested statistical display.<br>-The numbers
Q51: Use the statistical display to answer the
Q52: Use the figure to answer the question.<br>-The
Q53: Use the statistical display to answer the
Q55: Construct the requested statistical display.<br>-The weights
Q56: Identify whether the given scatterplot shows a
Q57: Use the circle graph to solve the