Multiple Choice
Construct the requested statistical display.
-The mileage ratings for city driving of various subcompact cars are listed below. Construct a line plot using the data.
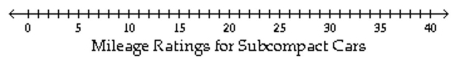
A) 
B) 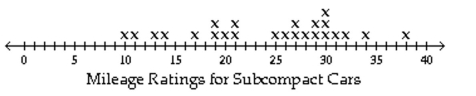
C) 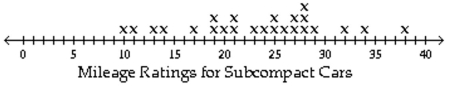
D) 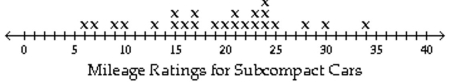
Correct Answer:

Verified
Correct Answer:
Verified
Related Questions
Q42: Use the figure to answer the question.<br>-The
Q43: Construct the requested statistical display.<br>-Kevin asked
Q44: Use the circle graph to solve the
Q45: Use the statistical display to answer the
Q46: Use the figure to answer the
Q48: Construct the requested statistical display.<br>-The one-day temperatures
Q49: Use the figure to answer the question.<br>-The
Q50: Construct the requested statistical display.<br>-The numbers
Q51: Use the statistical display to answer the
Q52: Use the figure to answer the question.<br>-The