Multiple Choice
Use the circle graph to solve the problem.
-In a school survey, students showed these preferences for instructional materials. 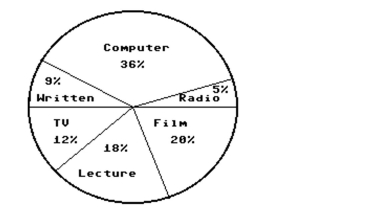 About how many students would you expect to prefer lectures in a school of 750 students?
A) About 135 students
B) About 150 students
C) About 270 students
D) About 18 students
Correct Answer:

Verified
Correct Answer:
Verified
Q47: Construct the requested statistical display.<br>-The mileage
Q48: Construct the requested statistical display.<br>-The one-day temperatures
Q49: Use the figure to answer the question.<br>-The
Q50: Construct the requested statistical display.<br>-The numbers
Q51: Use the statistical display to answer the
Q52: Use the figure to answer the question.<br>-The
Q53: Use the statistical display to answer the
Q54: Use the figure to answer the question.<br>-This
Q55: Construct the requested statistical display.<br>-The weights
Q56: Identify whether the given scatterplot shows a