Multiple Choice
Use the circle graph to solve the problem.
-In a school survey, students showed these preferences for instructional materials. 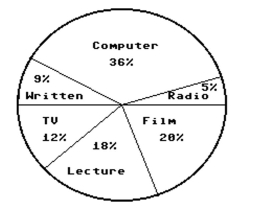 About how many students would you expect to prefer written materials in a school of 450 students?
A) About 81 students
B) About 9 students
C) About 162 students
D) About 41 students
Correct Answer:

Verified
Correct Answer:
Verified
Q39: Use the figure to answer the
Q40: Use the figure to answer the question.<br>-The
Q41: Construct the requested statistical display.<br>-The attendance
Q42: Use the figure to answer the question.<br>-The
Q43: Construct the requested statistical display.<br>-Kevin asked
Q45: Use the statistical display to answer the
Q46: Use the figure to answer the
Q47: Construct the requested statistical display.<br>-The mileage
Q48: Construct the requested statistical display.<br>-The one-day temperatures
Q49: Use the figure to answer the question.<br>-The