Multiple Choice
Construct the requested statistical display.
-Kevin asked some of his friends how many hours they worked during the previous week at their after-school jobs. Make a frequency table for the data.
A) 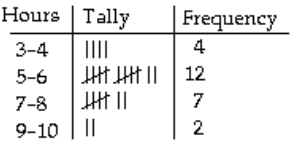
B) 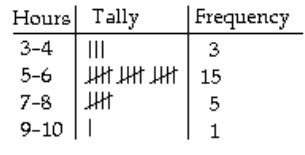
C) 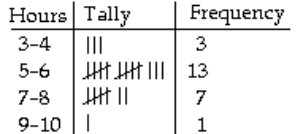
D) 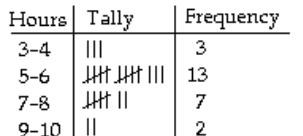
Correct Answer:

Verified
Correct Answer:
Verified
Q38: Identify whether the given scatterplot shows a
Q39: Use the figure to answer the
Q40: Use the figure to answer the question.<br>-The
Q41: Construct the requested statistical display.<br>-The attendance
Q42: Use the figure to answer the question.<br>-The
Q44: Use the circle graph to solve the
Q45: Use the statistical display to answer the
Q46: Use the figure to answer the
Q47: Construct the requested statistical display.<br>-The mileage
Q48: Construct the requested statistical display.<br>-The one-day temperatures