Multiple Choice
Data was collected on hand grip strength of adults. The histogram below summarizes the data. Which statement is true about the distribution of the data shown in the graph? 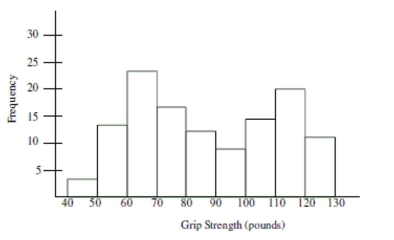
A) The graph shows evidence that two different groups may have been combined into one collection.
B) The graph is useless because it is bimodal.
C) There must have been a mistake made in data collection because the distribution should be bell-shaped.
D) The best estimate of typical grip strength is 80-90 pounds because it is in the center of the Distribution.
Correct Answer:

Verified
Correct Answer:
Verified
Q2: The graph below displays the number of
Q3: Which of the following statements best describes
Q5: The graph below displays the number of
Q6: Describe the shape of the distribution in
Q7: Choose the histogram that matches the description.<br>-The
Q8: Based on the histogram below, would it
Q10: The histogram below displays the distribution of
Q44: Which type of take- out food is
Q47: Write a sentence to compare color preferences
Q50: What was the most common response for