Multiple Choice
A sample of 55 streams in severe distress was obtained during 2007. The following bar graph illustrates the number of streams that are from the Northeast, Northwest, Southeast, or Southwest. In the bar graph, the bar for the Northeast has been omitted.
What percent of streams are not from the Northeast?
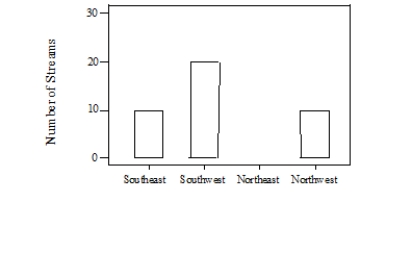
A) 27%
B) 40%
C) 73%
D) 75%
Correct Answer:

Verified
Correct Answer:
Verified
Q28: A sample of 40 endangered species was
Q29: The following histogram shows the yearly number
Q30: The following graph shows the percent of
Q31: The following dotplot shows migraine intensity (on
Q32: The following graph shows the percent of
Q33: Some variables were recorded while surveying plants
Q34: The U.S. Global Change Research Program examined
Q35: What is important to do when drawing
Q36: The U.S. Global Change Research Program examined
Q37: Stream quality is based on the levels