Multiple Choice
Data from the World Bank for 25 Western Hemisphere countries was used to examine the association between (average) female life expectancy (that is, the average lifespan of women in the country) and the average number of children women give birth to. Given below is the scatterplot for the data. 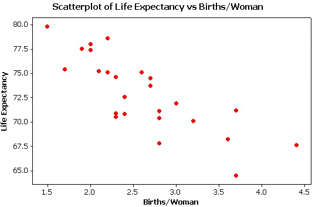 The regression equation for this context is found to be:
y= 84.5 - 4.4x
where Y is female life expectancy in years, and is the average number of births per woman.
-Interpret the slope in the context of the study.
A) We expect to see an increase of 84.5 years in female life expectancy when the average number of births per woman in a country increases by one child.
B) When a country has zero births per woman on average, we predict a female life expectancy of 84.5 years.
C) We expect to see a decrease of 4.4 years in female life expectancy when the average number of births per woman in a country increases by one child.
D) When a country has zero births per woman on average, we predict a female life expectancy of 4.4 years.
Correct Answer:

Verified
Correct Answer:
Verified
Q8: It is commonly expected that as a
Q9: Data from gapminder.org on 184 countries was
Q10: Data from gapminder.org on 184 countries was
Q11: It is commonly expected that as a
Q12: Data from gapminder.org on 184 countries was
Q14: The following scatterplot displays the finish time
Q15: It is commonly expected that as a
Q16: A student in an AP Statistics class
Q17: The following scatterplot displays the finish time
Q18: Which of the following plots has the