Multiple Choice
It is commonly expected that as a person ages, their muscle mass decreases. To further examine this relationship in women, a nutritionist randomly selected 60 female patients from her clinic, 15 women from each 10-year age group beginning with age 40 and ending with age 80. For each patient, her age and current muscle mass was recorded. A scatterplot, least squares regression line, and coefficient of determination are as follows. 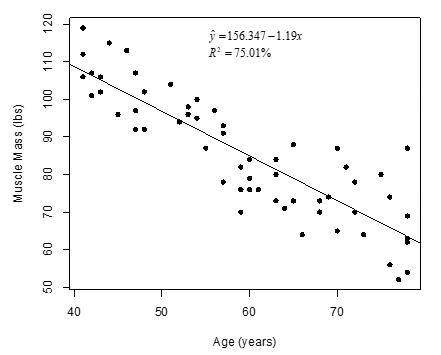
-Write the null and alternative hypotheses of interest for testing if there is a negative linear relationship between age and muscle mass using proper notation for a test of slope.
A)  versus
B)  versus
C)  versus
D)  versus
Correct Answer:

Verified
Correct Answer:
Verified
Q10: Data from gapminder.org on 184 countries was
Q11: It is commonly expected that as a
Q12: Data from gapminder.org on 184 countries was
Q13: Data from the World Bank for 25
Q14: The following scatterplot displays the finish time
Q16: A student in an AP Statistics class
Q17: The following scatterplot displays the finish time
Q18: Which of the following plots has the
Q19: Annual measurements of the number of powerboat
Q20: The following scatterplot displays the finish time