Multiple Choice
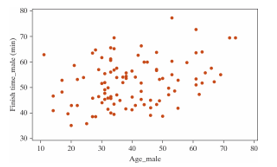
The following scatterplot displays the finish time (in minutes) and age (in years) for the male racers at the 2018 Strawberry Stampede (a 10k race through Arroyo Grande) .
 Below are the same data for the female racers in this year's race.
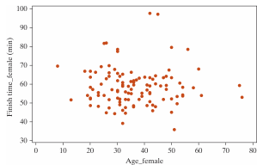
-Do you think the correlation coefficient for the females will be larger, smaller, or remain the same as the male's?
A) Larger
B) Smaller
C) Remain the same
Correct Answer:

Verified
Correct Answer:
Verified
Q9: Data from gapminder.org on 184 countries was
Q10: Data from gapminder.org on 184 countries was
Q11: It is commonly expected that as a
Q12: Data from gapminder.org on 184 countries was
Q13: Data from the World Bank for 25
Q15: It is commonly expected that as a
Q16: A student in an AP Statistics class
Q17: The following scatterplot displays the finish time
Q18: Which of the following plots has the
Q19: Annual measurements of the number of powerboat