Multiple Choice
A student in an AP Statistics class decided to conduct a study to determine whether you could predict the number of followers a teen has on Instagram based on the number of people he or she is following. To do this, she randomly selected fifty students from her high school that had Instagram accounts and for each student recorded the number of people they were following and the number of followers they had. A scatterplot of the data is shown.
The regression line is
.
followers=-45.3+1.21(following) 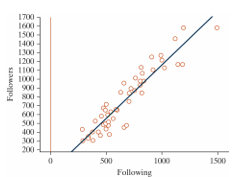
-A 95% confidence interval for the population slope is (1.07, 1.35) . How would you interpret this in the context of the study?
A) We are 95% confident that the population slope is between 1.07 and 1.35.
B) If we repeated this study many times, 95% of the regression slopes would fall between 1.07 and 1.35.
C) There is a 95% probability that the population slope is between 1.07 and 1.35.
D) We are 95% confident that a one person increase in the number of people one is following on Instagram is associated with between a 1.07 to 1.35 person increase in the number of followers.
E) Both A and D
F) Both A and B
G) Both B and C
Correct Answer:

Verified
Correct Answer:
Verified
Q11: It is commonly expected that as a
Q12: Data from gapminder.org on 184 countries was
Q13: Data from the World Bank for 25
Q14: The following scatterplot displays the finish time
Q15: It is commonly expected that as a
Q17: The following scatterplot displays the finish time
Q18: Which of the following plots has the
Q19: Annual measurements of the number of powerboat
Q20: The following scatterplot displays the finish time
Q21: A student in an AP Statistics class