Multiple Choice
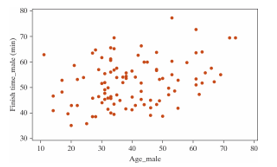
The following scatterplot displays the finish time (in minutes) and age (in years) for the male racers at the 2018 Strawberry Stampede (a 10k race through Arroyo Grande) .
 Below are the same data for the female racers in this year's race.
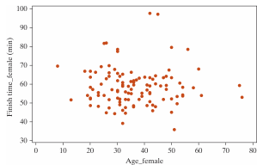
-What is the null hypothesis for a simulation-based test of the correlation coefficient for the females.
A) There is an association between female ages and female race finish times.
B) There is no association between female ages and female race finish times.
Correct Answer:

Verified
Correct Answer:
Verified
Q12: Data from gapminder.org on 184 countries was
Q13: Data from the World Bank for 25
Q14: The following scatterplot displays the finish time
Q15: It is commonly expected that as a
Q16: A student in an AP Statistics class
Q18: Which of the following plots has the
Q19: Annual measurements of the number of powerboat
Q20: The following scatterplot displays the finish time
Q21: A student in an AP Statistics class
Q22: The following scatterplot displays the finish time