True/False
To approximate the width of a class in the creation of a bar chart,we may use this formula: 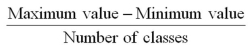 .
.
Correct Answer:

Verified
Correct Answer:
Verified
Related Questions
Q15: Exhibit 2-14.In the accompanying stem-and-leaf diagram,the values
Q16: The following histogram represents the number of
Q17: The following table shows the number of
Q18: Exhibit 2-14.In the accompanying stem-and-leaf diagram,the values
Q19: Exhibit 2-4.Students in Professor Smith's Business Statistics
Q21: Exhibit 2-4.Students in Professor Smith's Business Statistics
Q22: Exhibit 2-11.The accompanying relative frequency distribution represents
Q23: Exhibit 2-10.Automobiles traveling on a road with
Q24: What type of relationship is indicated in
Q25: Exhibit 2-7.Thirty students at Eastside High School