Multiple Choice
Exhibit 2-14.In the accompanying stem-and-leaf diagram,the values in the stem and leaf portions represent 10s and 1s digits,respectively. 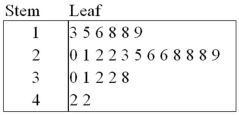 Refer to Exhibit 2-14.The stem-and-leaf diagram shows that the distribution is __________.
A) Symmetric
B) Positively skewed
C) Negatively skewed
D) None of the above
Correct Answer:

Verified
Correct Answer:
Verified
Q13: The following table lists some of the
Q14: The following table shows average wind speeds
Q15: Exhibit 2-14.In the accompanying stem-and-leaf diagram,the values
Q16: The following histogram represents the number of
Q17: The following table shows the number of
Q19: Exhibit 2-4.Students in Professor Smith's Business Statistics
Q20: To approximate the width of a class
Q21: Exhibit 2-4.Students in Professor Smith's Business Statistics
Q22: Exhibit 2-11.The accompanying relative frequency distribution represents
Q23: Exhibit 2-10.Automobiles traveling on a road with