Multiple Choice
Exhibit 2-4.Students in Professor Smith's Business Statistics course have evaluated the overall effectiveness of the professor's instruction on a five-point scale,where a score of 1 indicates very poor performance and a score of 5 indicates outstanding performance.The raw scores are displayed in the accompanying table: 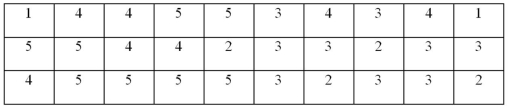 Refer to Exhibit 2-4.What percentage of students gave Professor Smith an evaluation of 2 or less?
A) 6.7%
B) 13.3%
C) 20%
D) 80%
Correct Answer:

Verified
Correct Answer:
Verified
Q14: The following table shows average wind speeds
Q15: Exhibit 2-14.In the accompanying stem-and-leaf diagram,the values
Q16: The following histogram represents the number of
Q17: The following table shows the number of
Q18: Exhibit 2-14.In the accompanying stem-and-leaf diagram,the values
Q20: To approximate the width of a class
Q21: Exhibit 2-4.Students in Professor Smith's Business Statistics
Q22: Exhibit 2-11.The accompanying relative frequency distribution represents
Q23: Exhibit 2-10.Automobiles traveling on a road with
Q24: What type of relationship is indicated in