Multiple Choice
Exhibit 2-8.Consider the following frequency distribution. 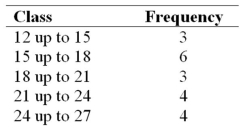 Refer to Exhibit 2-8.The total number of observations in the frequency distribution is _____.
A) 5
B) 6
C) 20
D) 24
Correct Answer:

Verified
Correct Answer:
Verified
Related Questions
Q13: When constructing a scatterplot for two quantitative
Q39: Use the following data to construct a
Q40: Exhibit 2-6.The following data represent the recent
Q41: The accompanying chart shows the numbers of
Q43: Exhibit 2-9.An analyst constructed the following frequency
Q46: Exhibit 2-5.The following data represent scores on
Q47: What type of relationship is indicated in
Q48: Exhibit 2-11.The accompanying relative frequency distribution represents
Q49: Exhibit 2-13.The organization of the Girl Sprouts
Q69: A bar chart depicts the frequency or