Multiple Choice
The figures show a contour graph for a function f in blue with a constraint function  in black. Estimate any optimal points for the system
 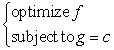 Classify each constrained optimal point as a maximum or a minimum.
A) (28, 21, 4.5) : constrained minimum
B) (24, 20, 4.5) : constrained minimum
C) (25, 21, 4.5) : constrained minimum
D) (28, 20, 5.5) : constrained maximum
E) (25, 24,3.5) : constrained maximum
Correct Answer:

Verified
Correct Answer:
Verified
Q4: The table below gives the number of
Q5: Identify the optimal point as either a
Q6: The table below gives the number of
Q7: Suppose the table shows the average price
Q8: Before technology was available to fit many
Q10: A travel agency offers spring-break cruise packages.
Q11: A small percent of homes in an
Q12: Suppose that <img src="https://d2lvgg3v3hfg70.cloudfront.net/TB6775/.jpg" alt="Suppose that
Q13: A factory makes 7-mm aluminum ball bearings.
Q14: A manufacture is designing a packaging carton