Multiple Choice
The table below gives the number of inches of precipitation that fell in a city in the given months. Use the method of least squares to find the multivariable function f with inputs a and b for the best fitting line  where x is 1 in January, 2 in February, and 3 in March. What is the minimum value of
  Give your answer to two decimal places.
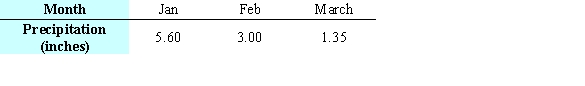
A) 0.00
B) 1.35
C) 42.18
D) 0.07
E) 0.15
Correct Answer:

Verified
Correct Answer:
Verified
Q1: Suppose table shows the average price of
Q2: The consistometer table gives the consistency of
Q3: The number of animal experiments in a
Q5: Identify the optimal point as either a
Q6: The table below gives the number of
Q7: Suppose the table shows the average price
Q8: Before technology was available to fit many
Q9: The figures show a contour graph for
Q10: A travel agency offers spring-break cruise packages.
Q11: A small percent of homes in an