Multiple Choice
The table below gives the number of inches of precipitation that fell in a city in the given months. Give the linear model  that best fits the data, where x is 1 in January, 2 in February, and 3 in March. Give the coefficients to two decimal places.
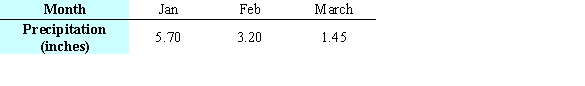
A) 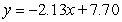
B) 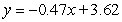
C) 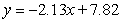
D) 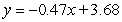
E) 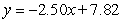
Correct Answer:

Verified
Correct Answer:
Verified
Related Questions
Q1: Suppose table shows the average price of
Q2: The consistometer table gives the consistency of
Q3: The number of animal experiments in a
Q4: The table below gives the number of
Q5: Identify the optimal point as either a
Q7: Suppose the table shows the average price
Q8: Before technology was available to fit many
Q9: The figures show a contour graph for
Q10: A travel agency offers spring-break cruise packages.
Q11: A small percent of homes in an